Overview
The Data Features Toolkit (DFT) interface provides an intuitive, visual workflow builder for data transformation and feature engineering. It allows users to build sequential data pipelines leveraging functions from a comprehensive library, executing individual steps, and visualizing data transformations in each step.
By providing a no-code environment, this component bridges the gap between raw data ingestion and model-ready features, making complex data manipulation accessible and reproducible.
Getting Started
Do you want to build your first pipeline? Start with the Step-by-Step Tutorial.
Core Components
The DFT operates across two main interfaces:
1. Data Features Toolkit Landing Page
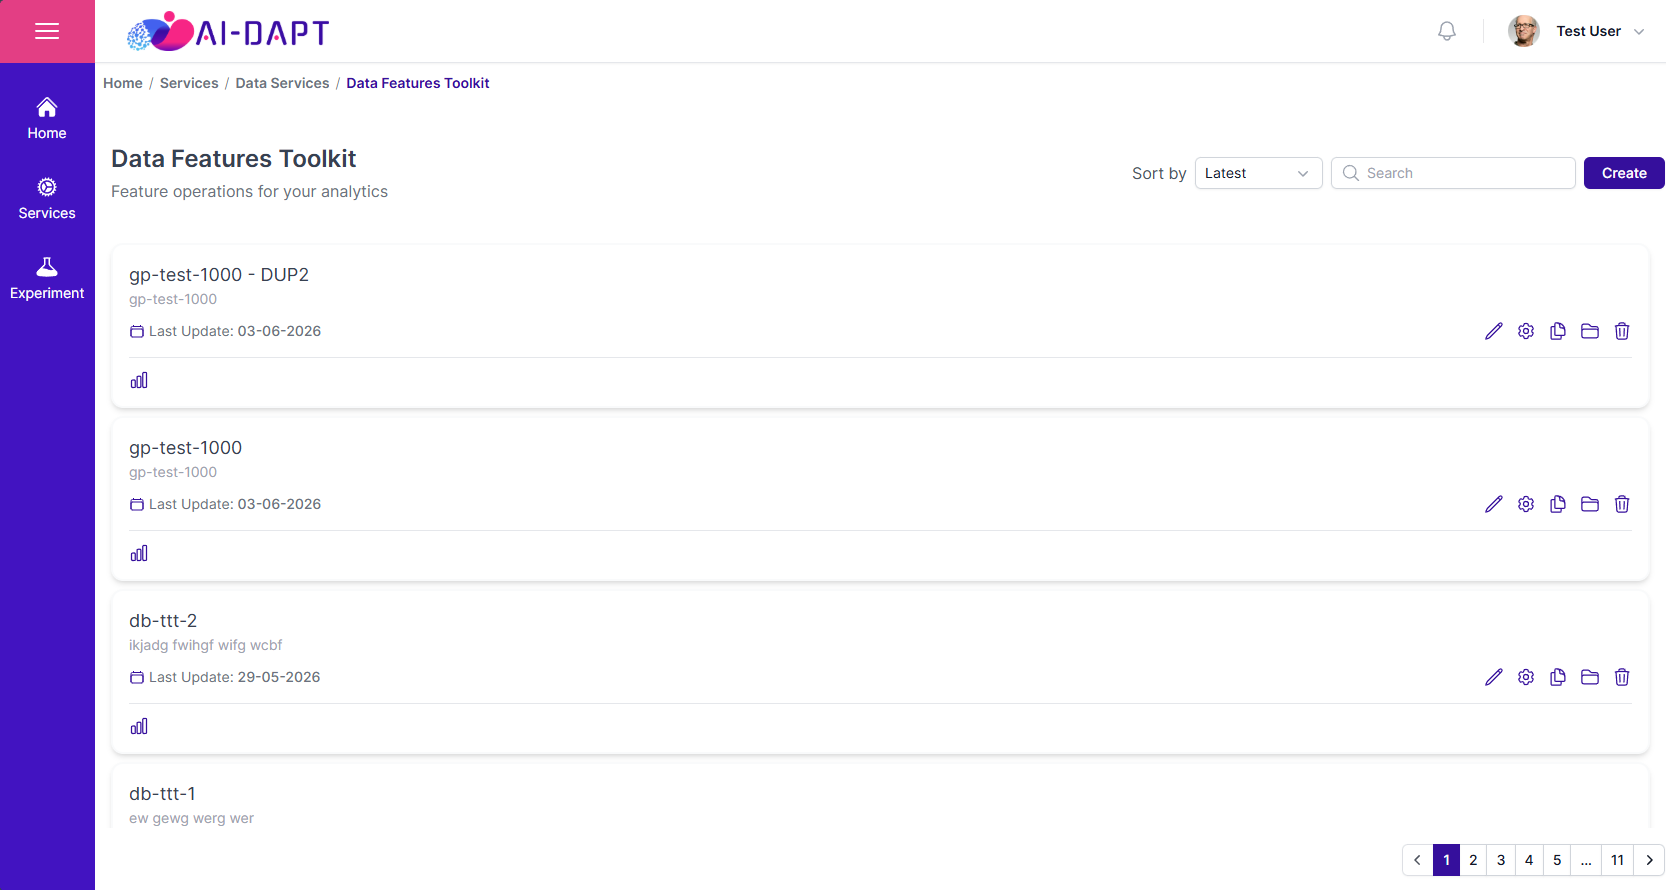
When you first access the toolkit, you are presented with the main management dashboard. This page acts as the central hub for all data pipeline projects.
-
Manage: Displays a list of all existing pipeline projects, showing details such as project name, description, and the last update timestamp.
-
Control: Each project card features quick-action utilities to edit details, clone pipelines, or delete projects.
-
Find: Includes a search bar and sorting dropdowns (e.g., "Sort by Latest") to quickly locate specific pipelines across large organizations.
-
Create: The Create button in the top right allows you to instantiate a completely new feature pipeline project.
2. Project Configuration Page
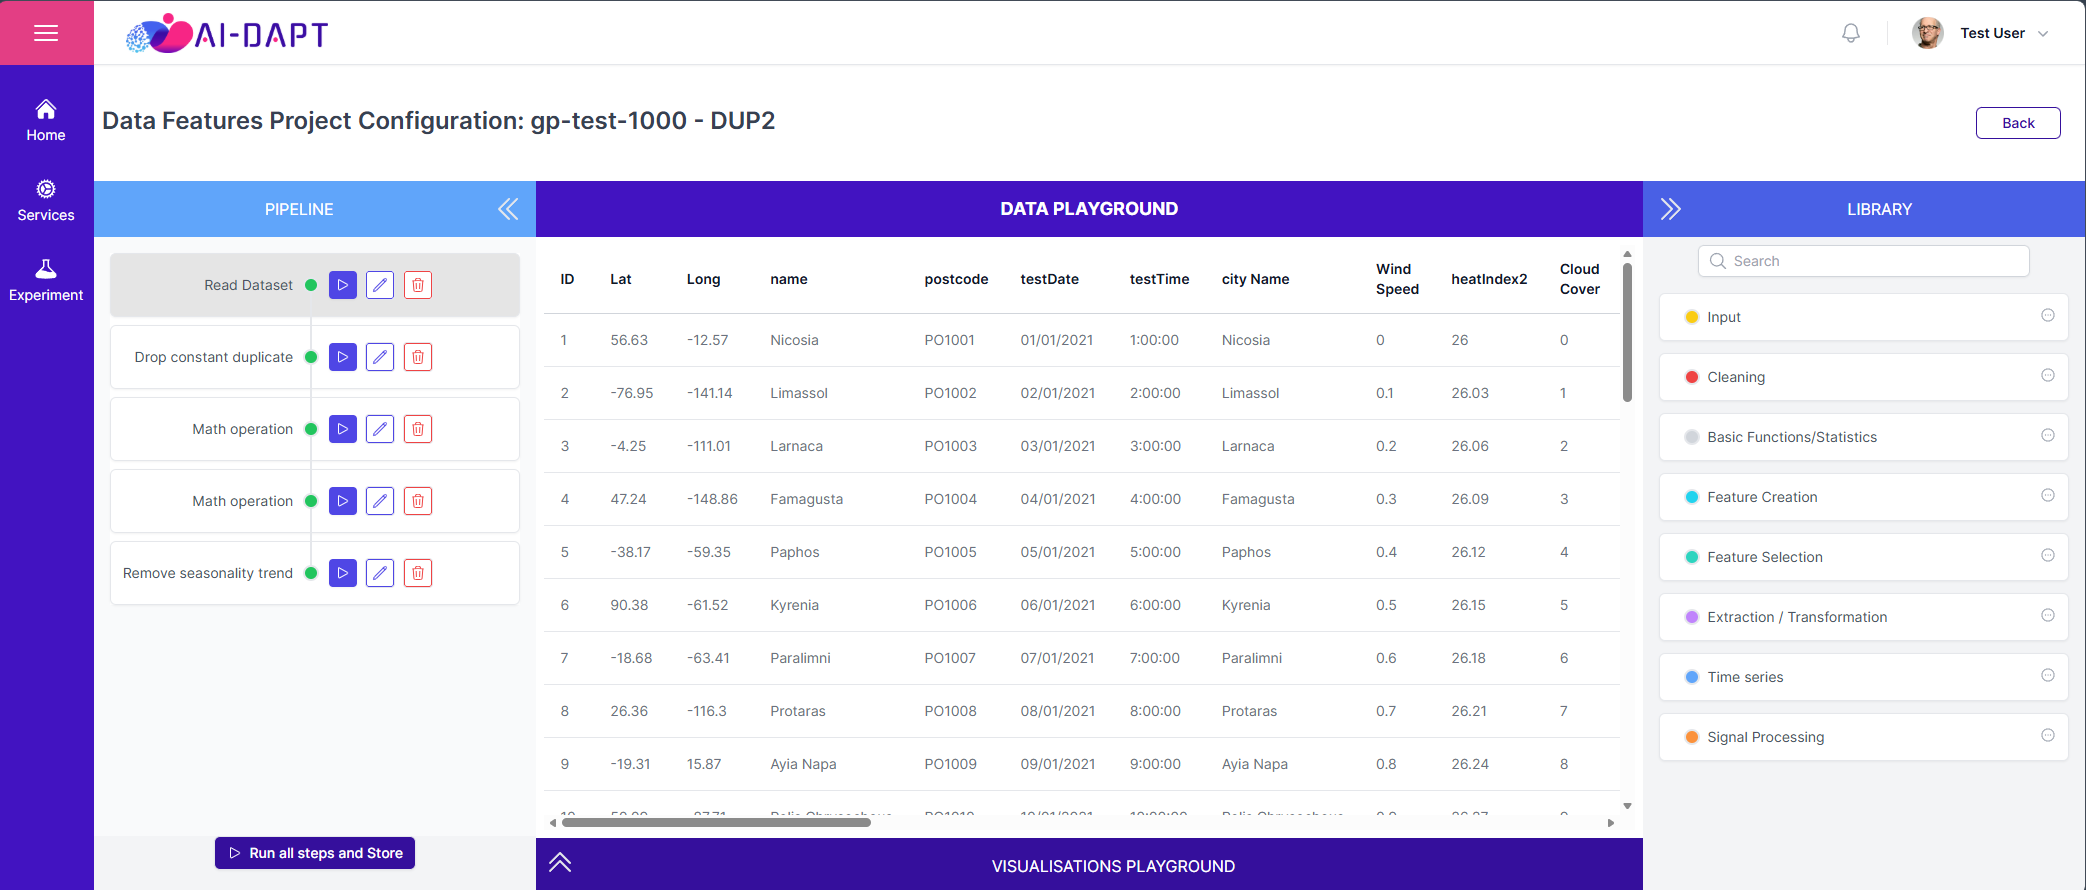
Clicking into or creating a project brings you to the Data Features Project Configuration workspace, in which you can define the logic for your feature pipeline.
The workspace is divided into four zones:
-
Pipeline (Left Panel): Displays the sequential list of tasks (blocks) configured for the current project. Each step features individual controls to run, edit, or delete that specific block. The user is able to change the order of blocks by dragging and dropping them within the panel.
-
Data Playground (Center Panel): The inspection space. It allows the user to preview the resulting data frame of the current step, by clicking on the respective executed block of the pipeline.
-
Visualisations Playground (Bottom Panel): A space for visualizing the current data frame with a visualization based on the current block.
-
Library (Right Panel): A searchable repository of all available analytical, transformation, and feature engineering building blocks organized into categories. By selecting a block, the user can configure its parameters and add it to the pipeline. For more information on the available blocks, see the Blocks Library.