Correlation Analysis
This method computes pairwise correlations between numeric features using Pearson and/or Spearman and/or Kendall correlation. The output is a correlation matrix that helps you spot relationships, redundancy, and potential multicollinearity in your dataset.
How to run (UI)
-
Open the link for the correlation along with dataset-id parameter (e.g.,
https://data-valuation-ui.aidapt.s5projects.eu/correlation?dataset-id=XXX) -
Choose the correlation method (Pearson and/or Spearman and/or Kendall)
Specifically
-
Pearson for linear relationships
-
Spearman for monotonic relationships and better robustness to non linear patterns and outliers
-
Kendall for Kendall relationships
-
Select any combination if you want to compare the two views
-
-
Click Run Correlation Analysis
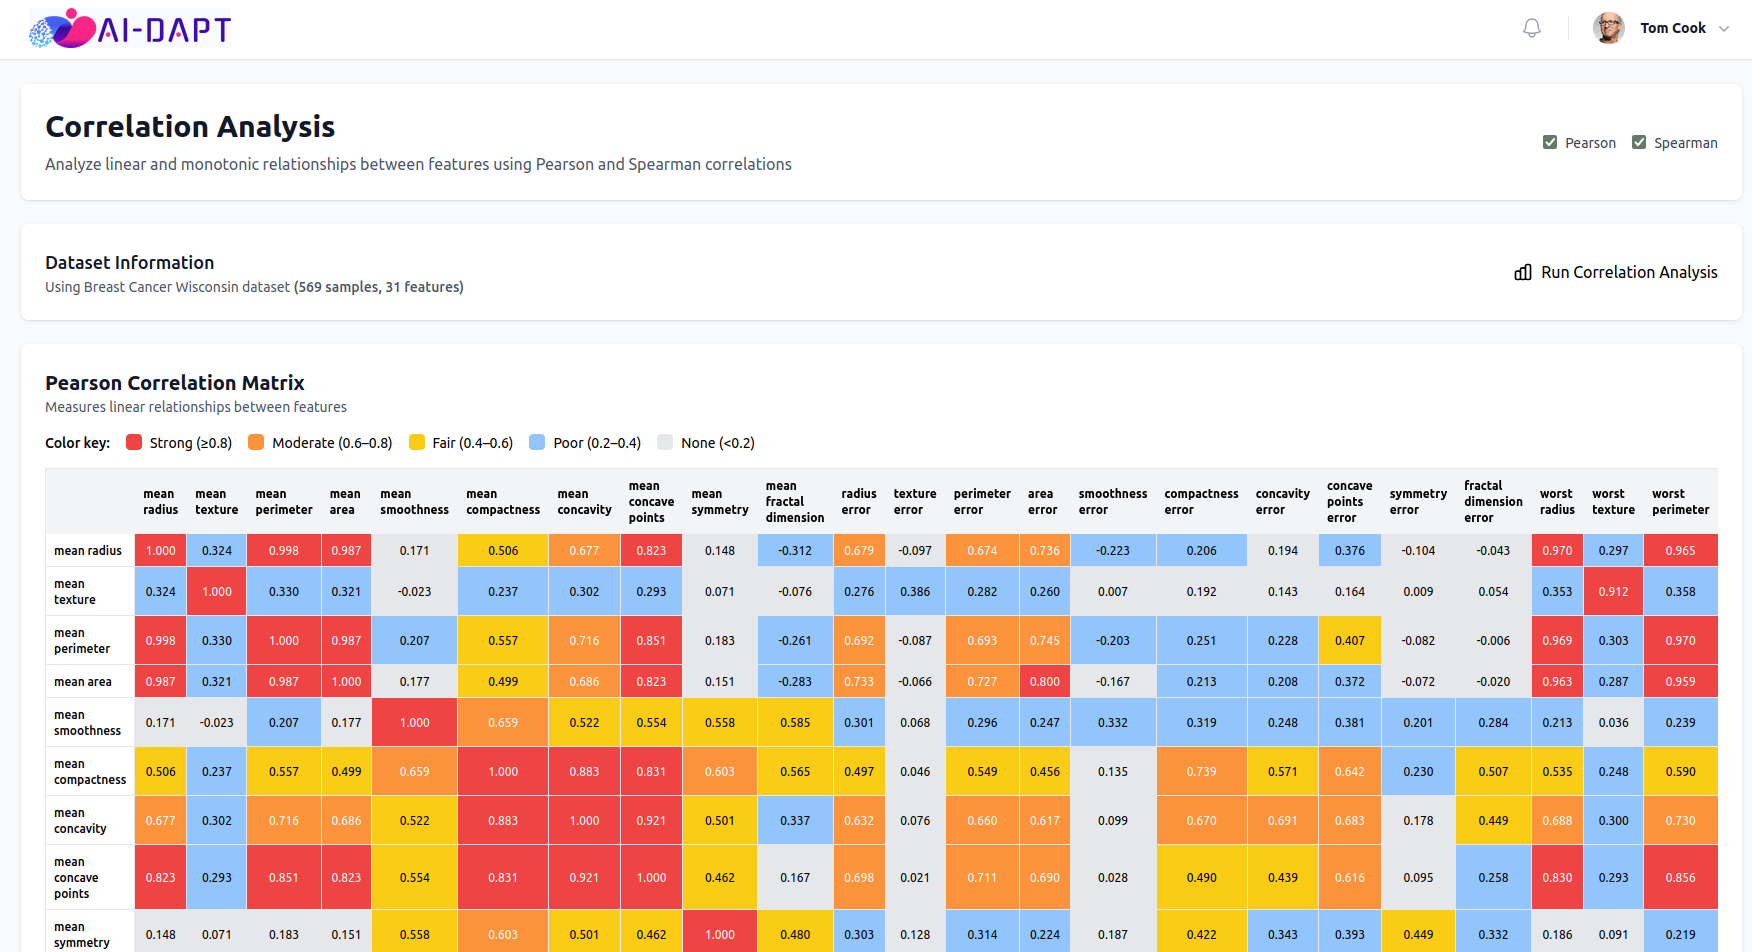 Figure 1. Correlation Analysis UI output.
 -
Review the correlation matrices
-
Heatmap colors indicate the strength of the relationship
-
Values on the diagonal are always
1because each feature is perfectly correlated with itself
-
-
Optionally download the results as CSV for further analysis
Interpretation
A correlation value ranges from -1 to +1
-
Values close to
+1indicate a strong positive relationship -
As one feature increases, the other tends to increase
-
Values close to
-1indicate a strong negative relationship -
As one feature increases, the other tends to decrease
-
Values close to
0indicate a weak or no relationship
Notes and good practice
-
High absolute correlation, for example
|r| > 0.8, can indicate redundant features and possible multicollinearity for linear models -
Correlation does not imply causation. Use it as an exploratory signal rather than proof of a causal effect
-
Non numeric and constant features are ignored in this analysis