Configure your First project
This guide uses a Regression model as an example to demonstrate the setup process.
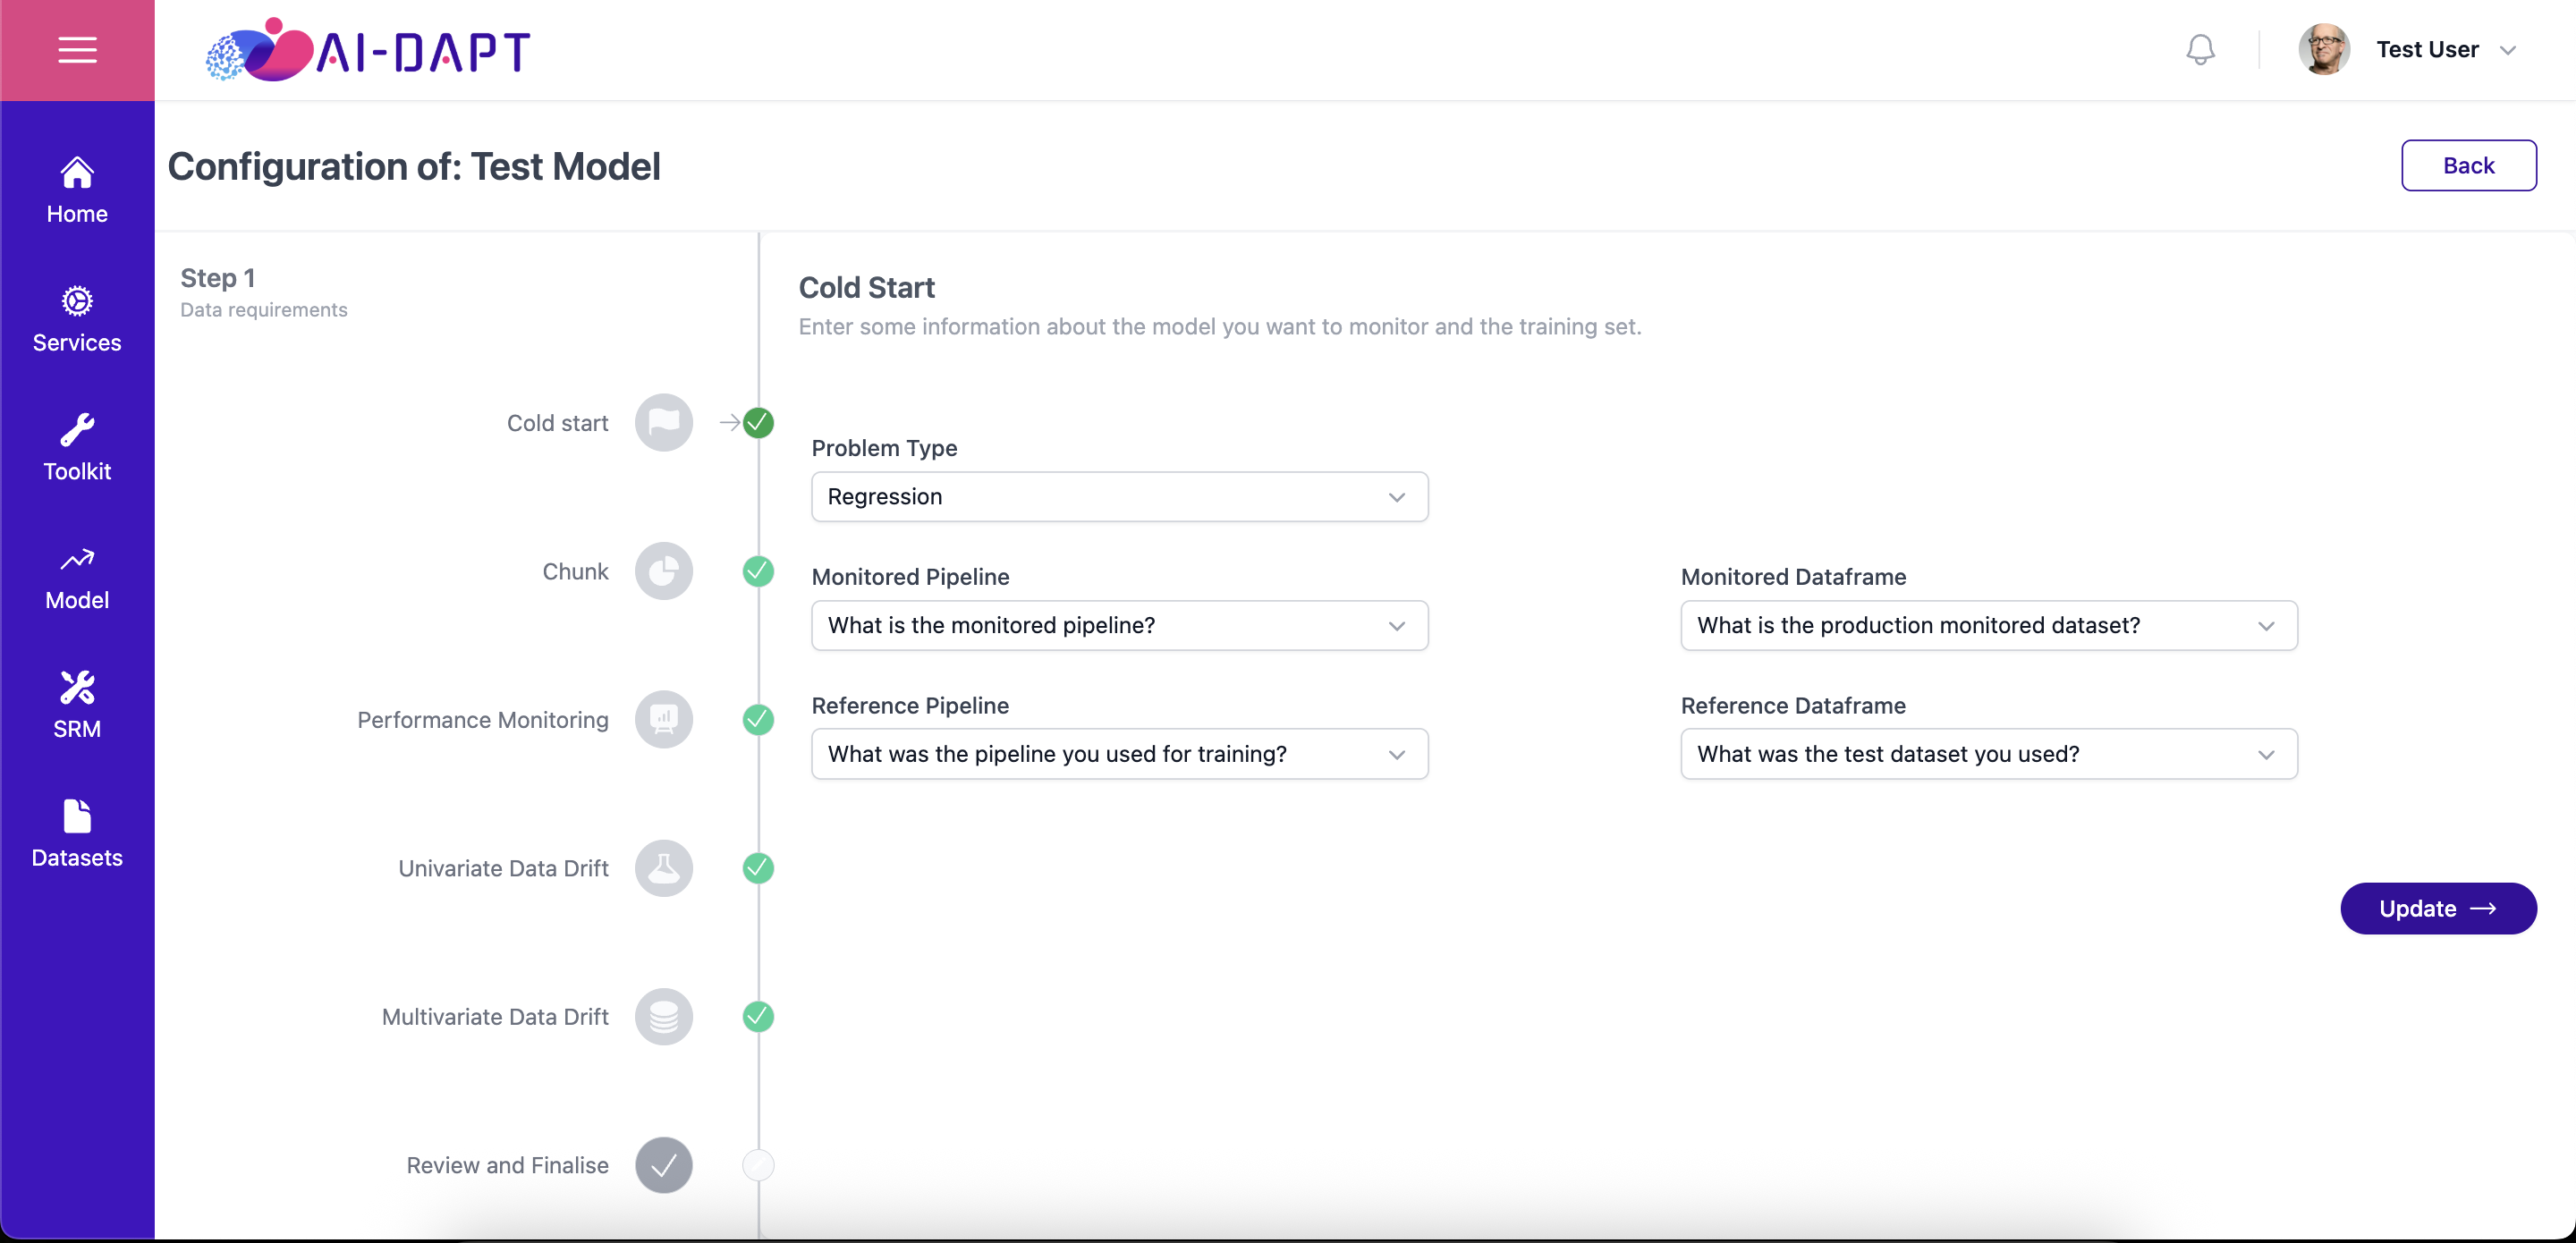
Step 1: Cold Start
-
Select your Problem Type - Regression.
-
Choose your Reference Pipeline and its associated dataframe. This is usually your test set from the training phase and must include:
-
Features
-
Model predictions
-
Ground truth labels
-
-
Choose your Monitored Pipeline and its associated dataframe. This is your production data.
|
Schema Validity: The monitored dataframe must have a schema identical to the reference dataframe - feature columns, model predictions, ground truth column even if empty. Discrepancies will result in failure. |
Step 2: Chunk Preferences
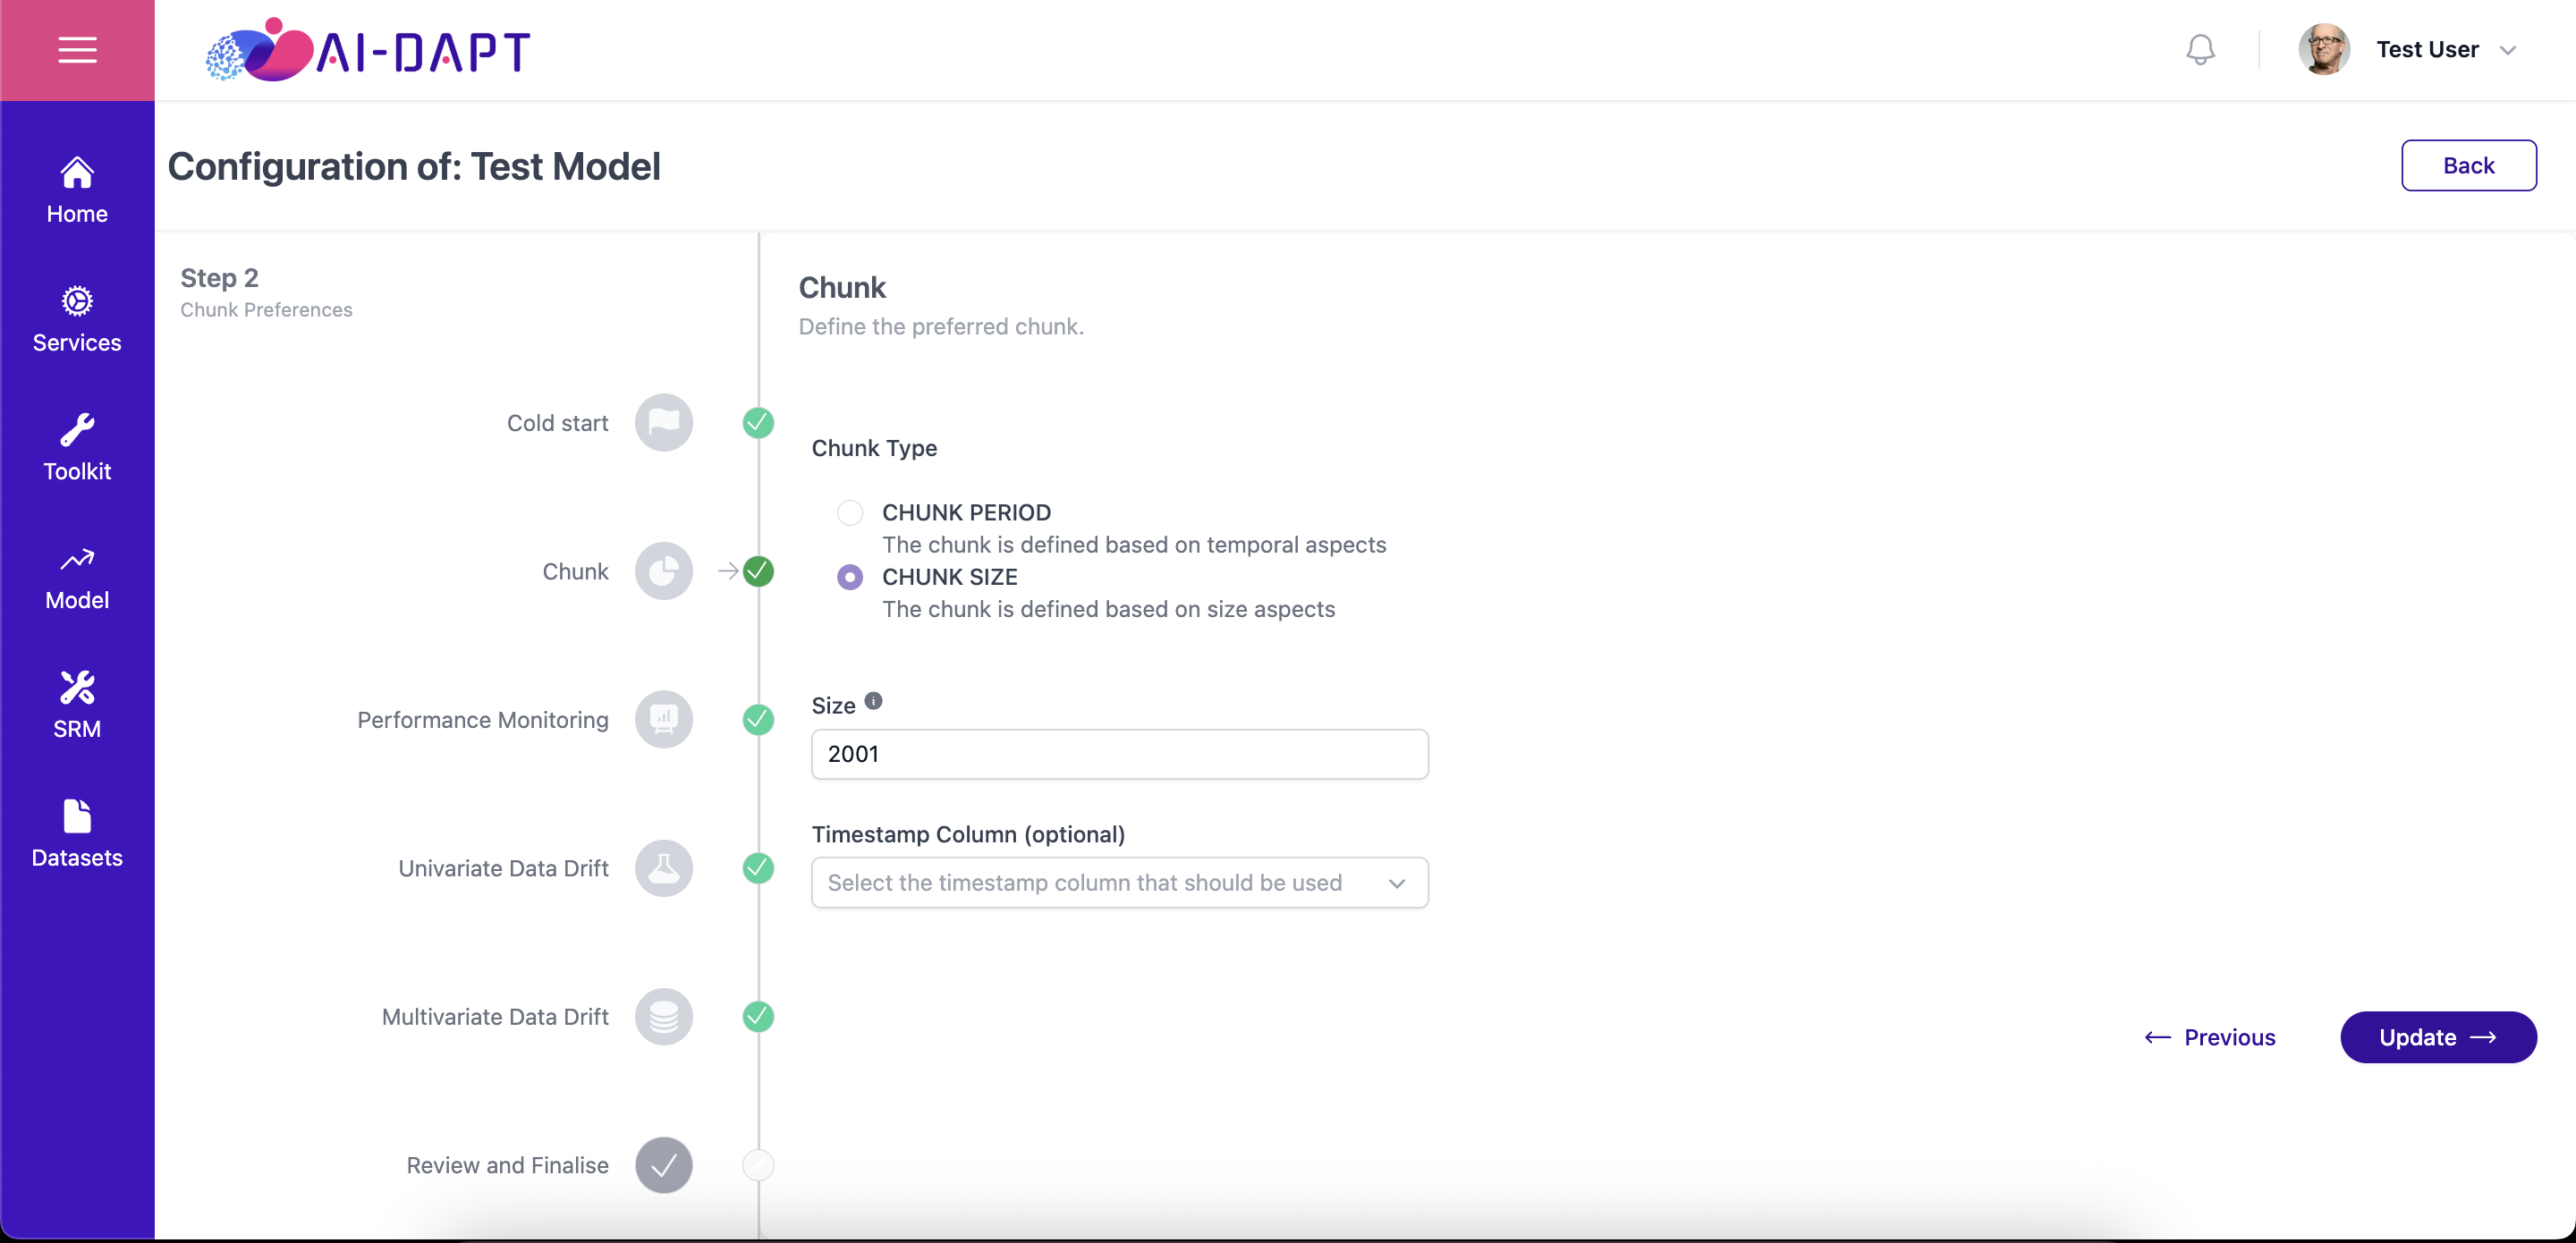
Specify how you want to aggregate your data.
-
Select a Timestamp column.
-
Select a Grouping Period (Hour, Day, Week, Month, Quarter, or Year).
|
Choosing the right grouping: Small chunks provide faster alerts but may result in noise or false positives. Larger chunks provide more stable statistical results but may delay detection of a sudden model failure. |
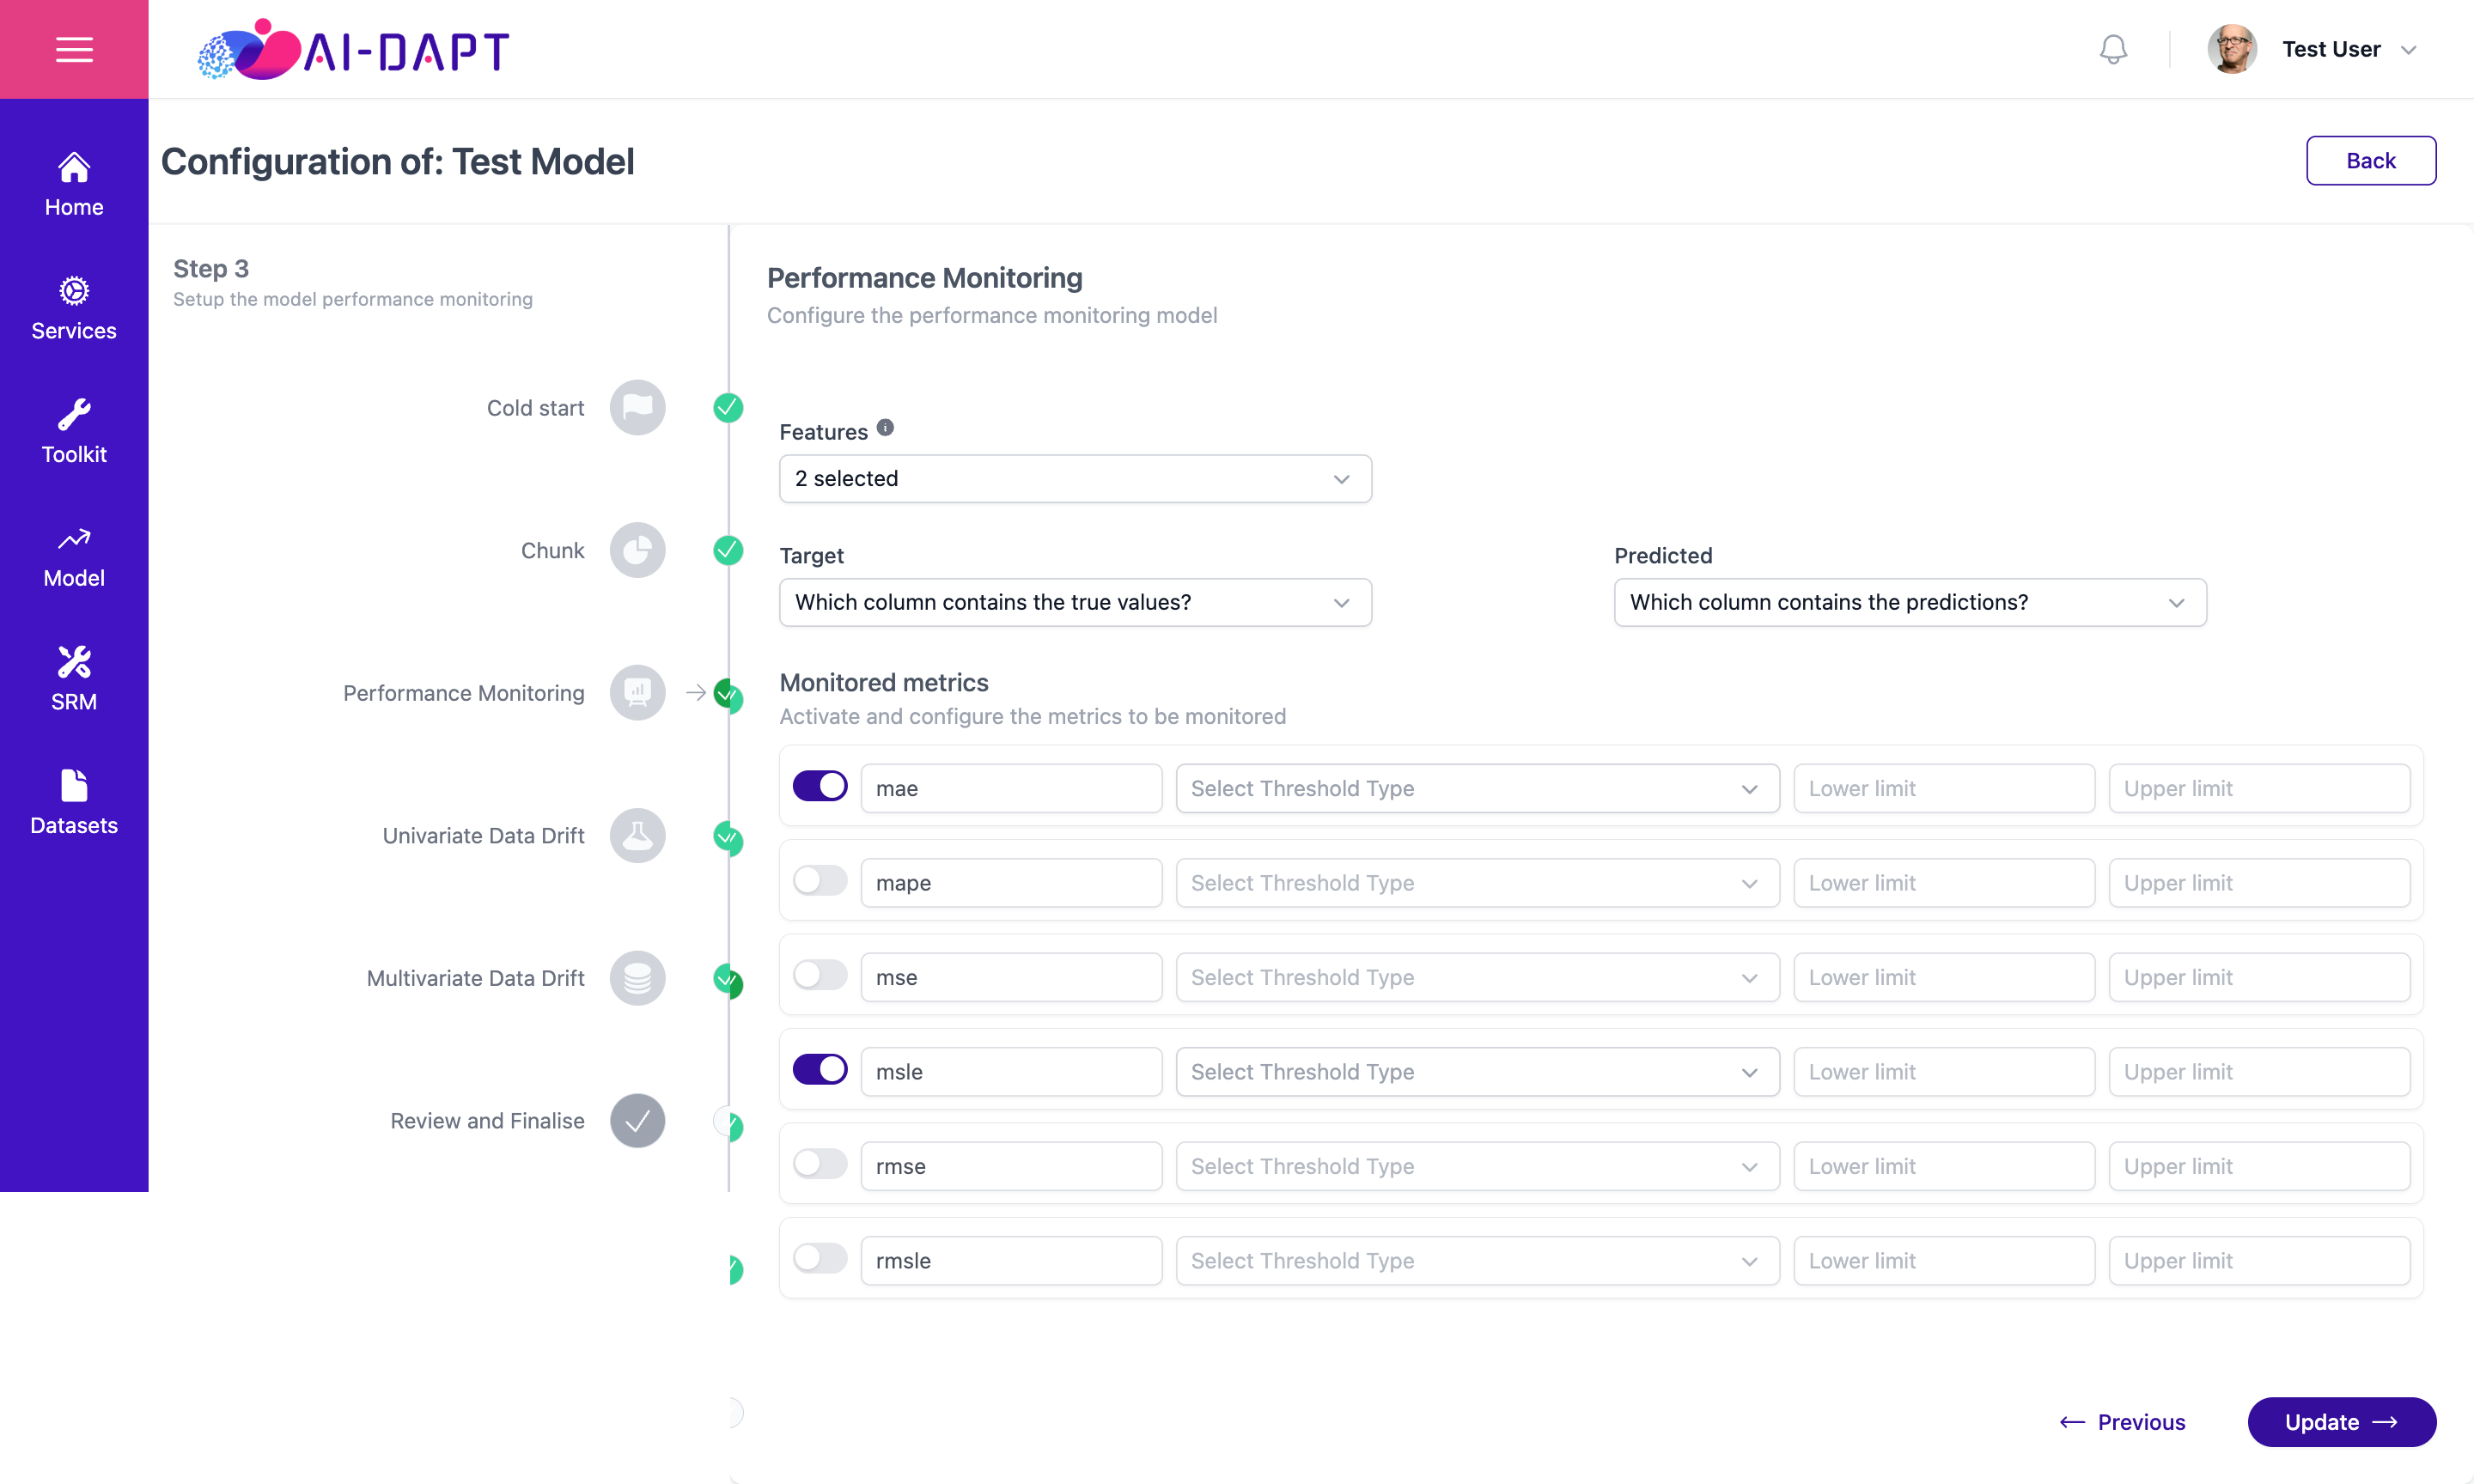
Step 3: Performance Monitoring (Optional)
-
Identify the Features used during training.
-
Map the Target Column (ground truth) and the Prediction Column.
-
Select one or more Performance Metrics (e.g. MAE, MSLE).
-
(Optional) Set a Threshold Type with upper and lower bounds for each metric. If left blank, the system will automatically configure thresholds based on your reference data.
Step 4: Univariate Data Drift
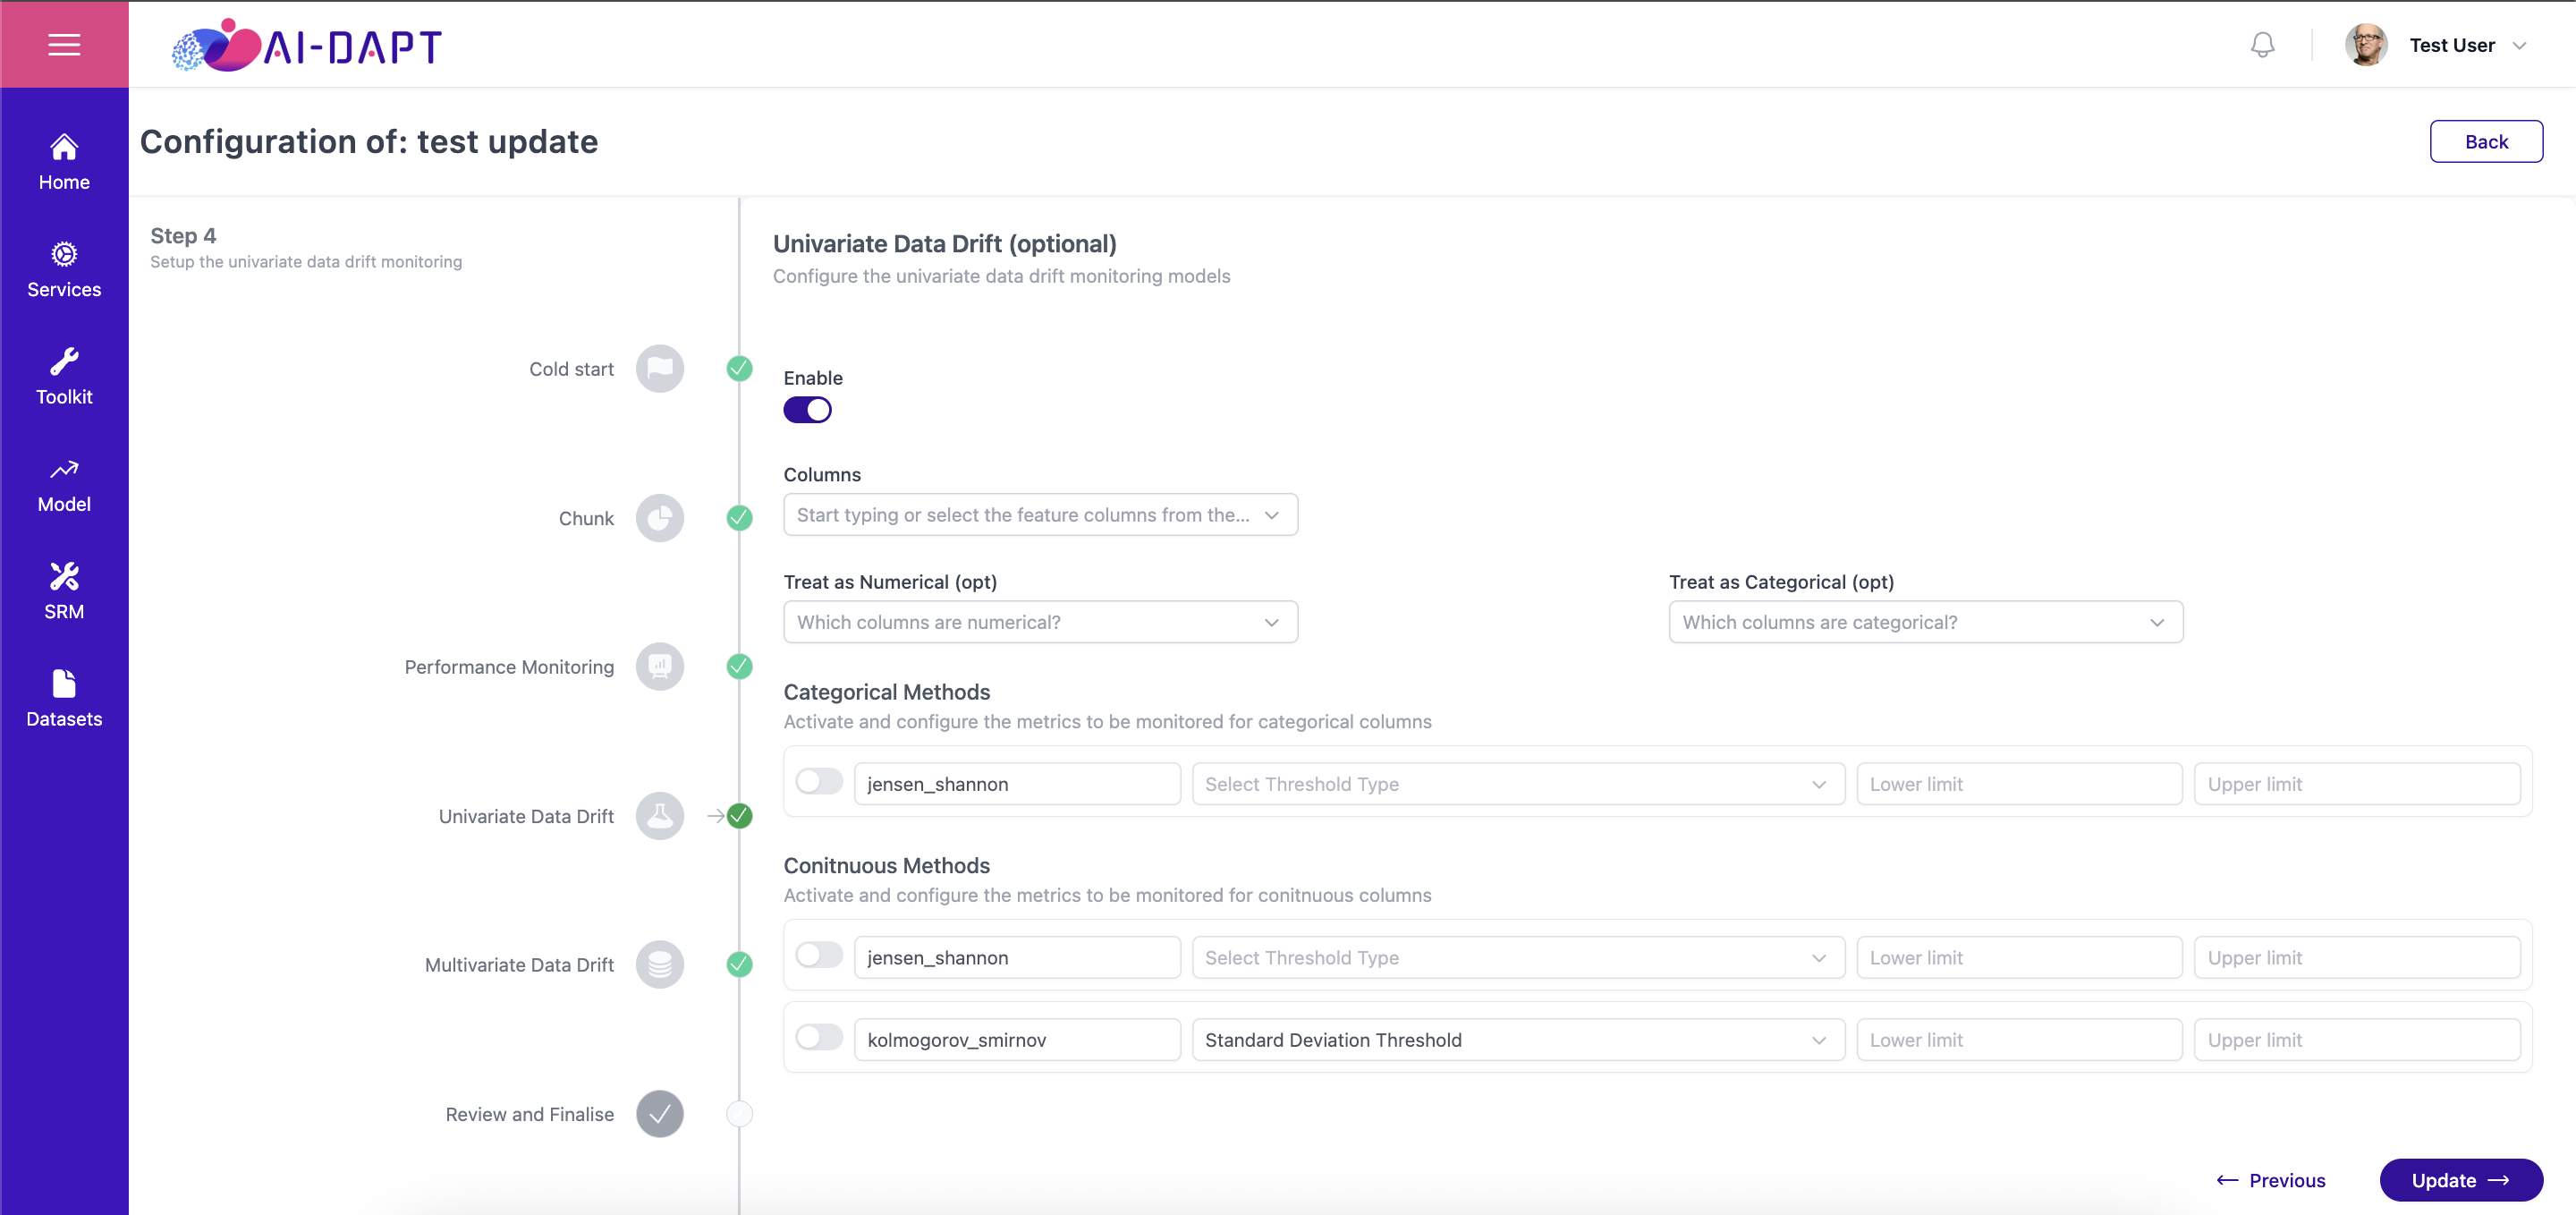
Enable this step to analyze features individually.
-
Select the Features you wish to analyze.
-
(Optional) Assign a Type per feature (Numerical or Categorical). If unassigned, the system defaults to the most appropriate one.
-
Assign a Method per type (Numerical or Categorical). If unassigned, the system uses the default one.
-
(Optional) Set a Threshold Type with upper and lower bounds for each method. If left blank, the system will automatically configure thresholds based on your reference data.
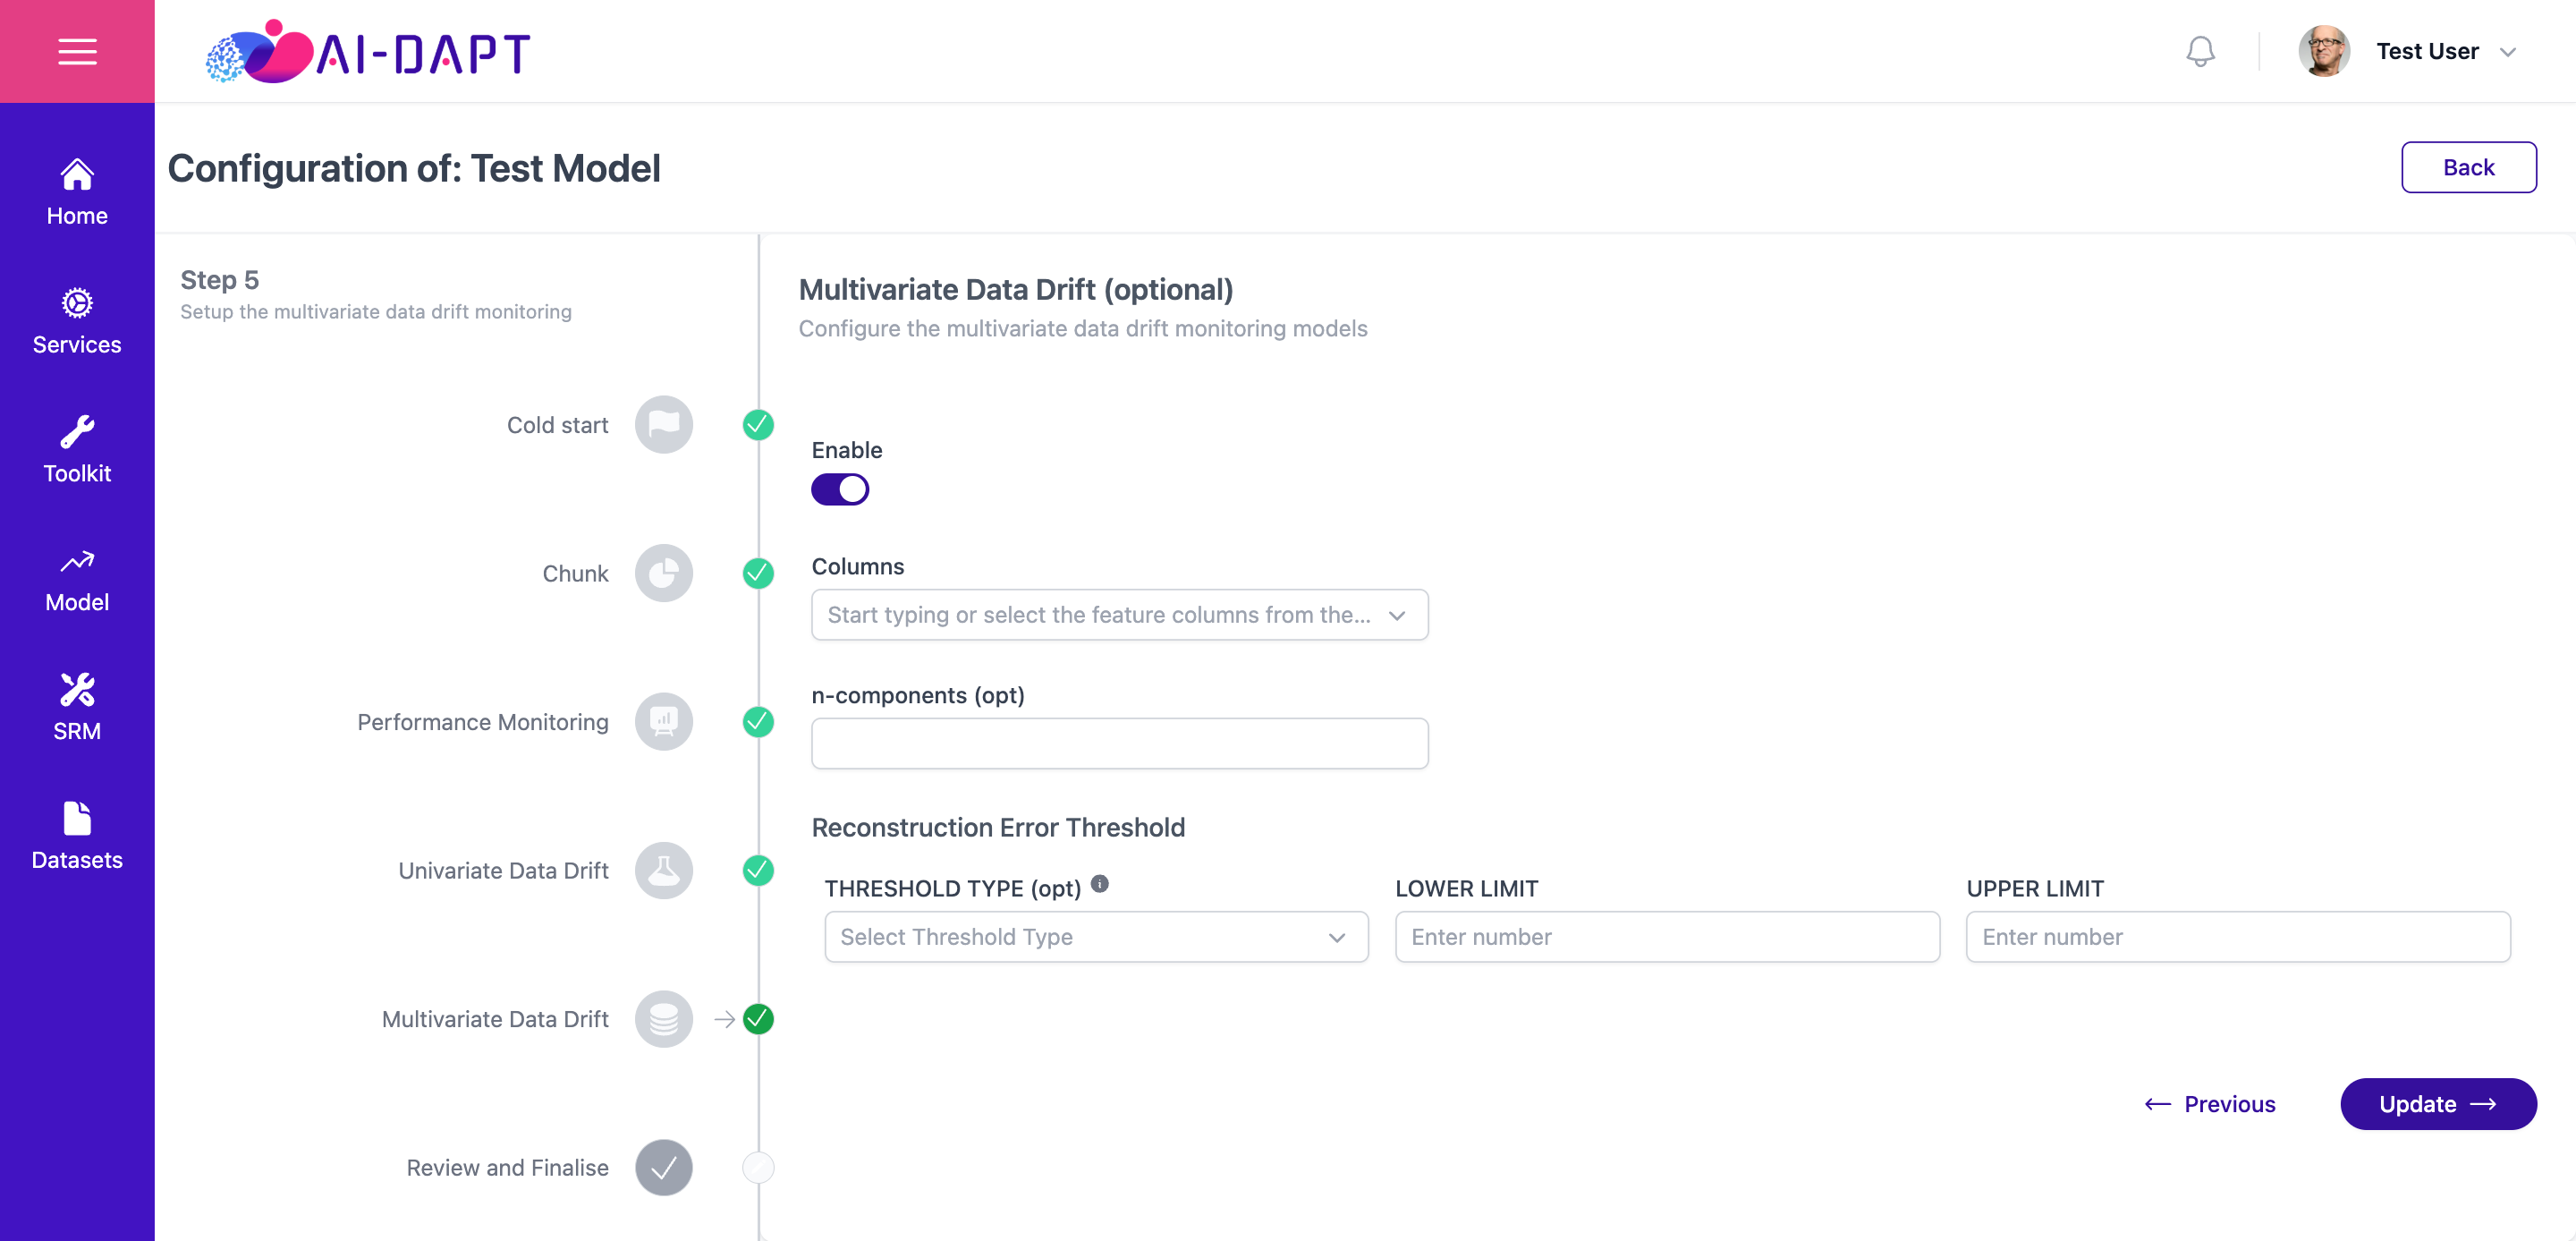
Step 5: Multivariate Data Drift (Optional)
Enable this step to analyze how features behave as a collective set.
-
Select the Features for analysis.
-
(Optional) Set a Threshold Type with upper and lower bounds. If left blank, the system will automatically configure thresholds based on your reference data.
Step 6: Review and Finalise
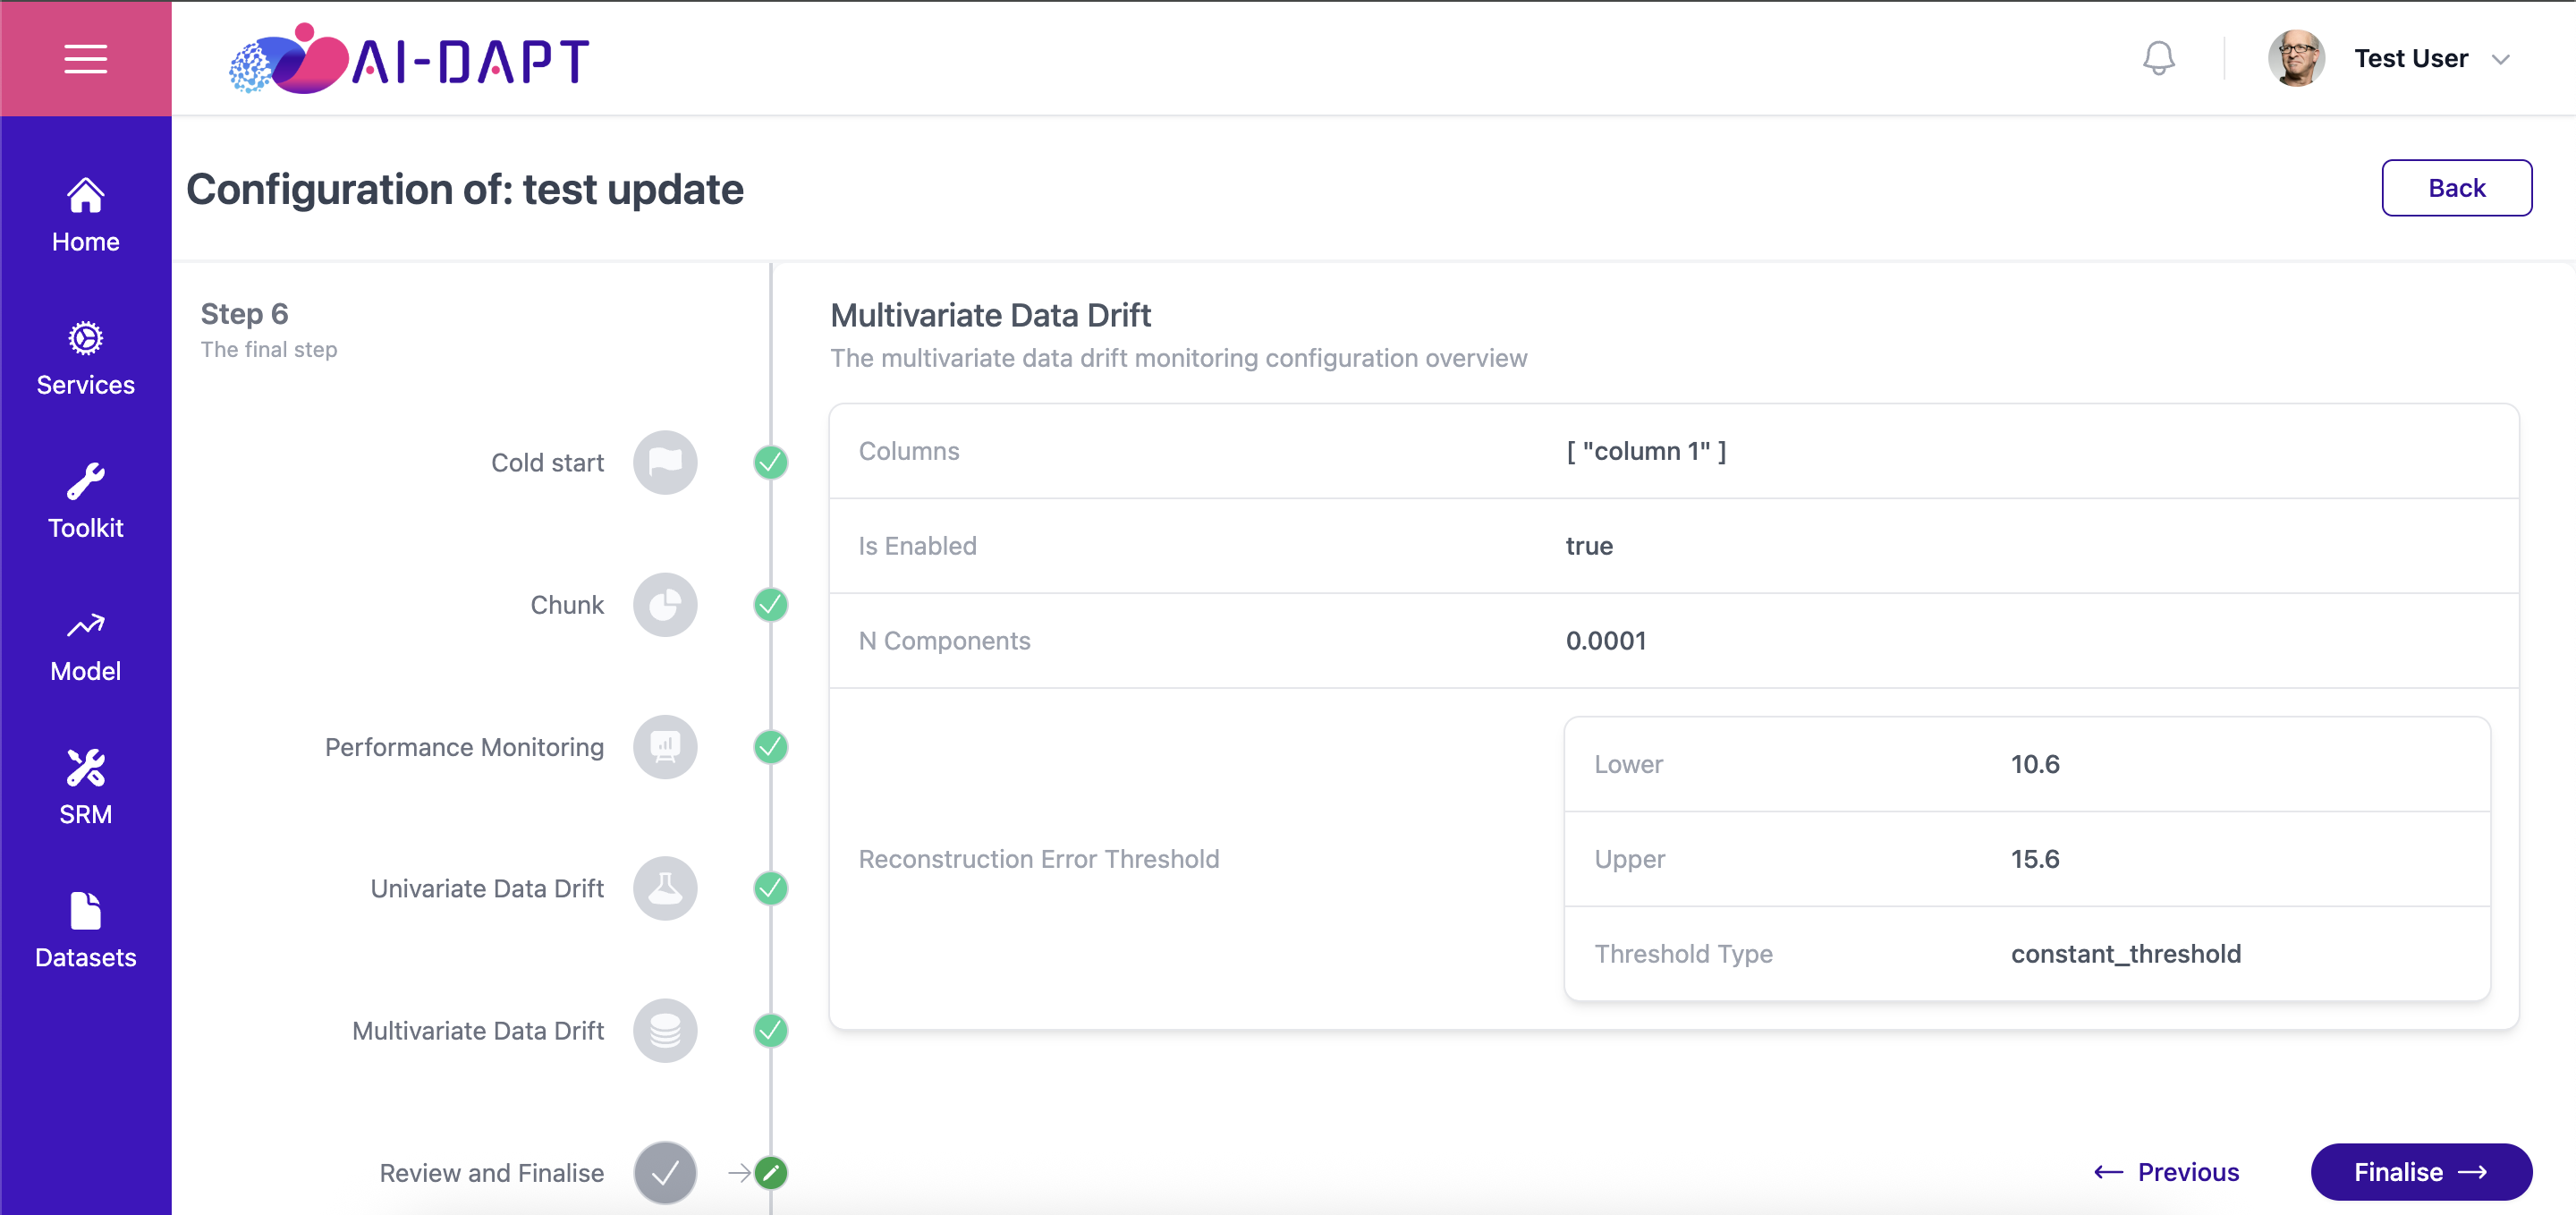
Review your configurations and click Finalise to deploy the observability service for your project.
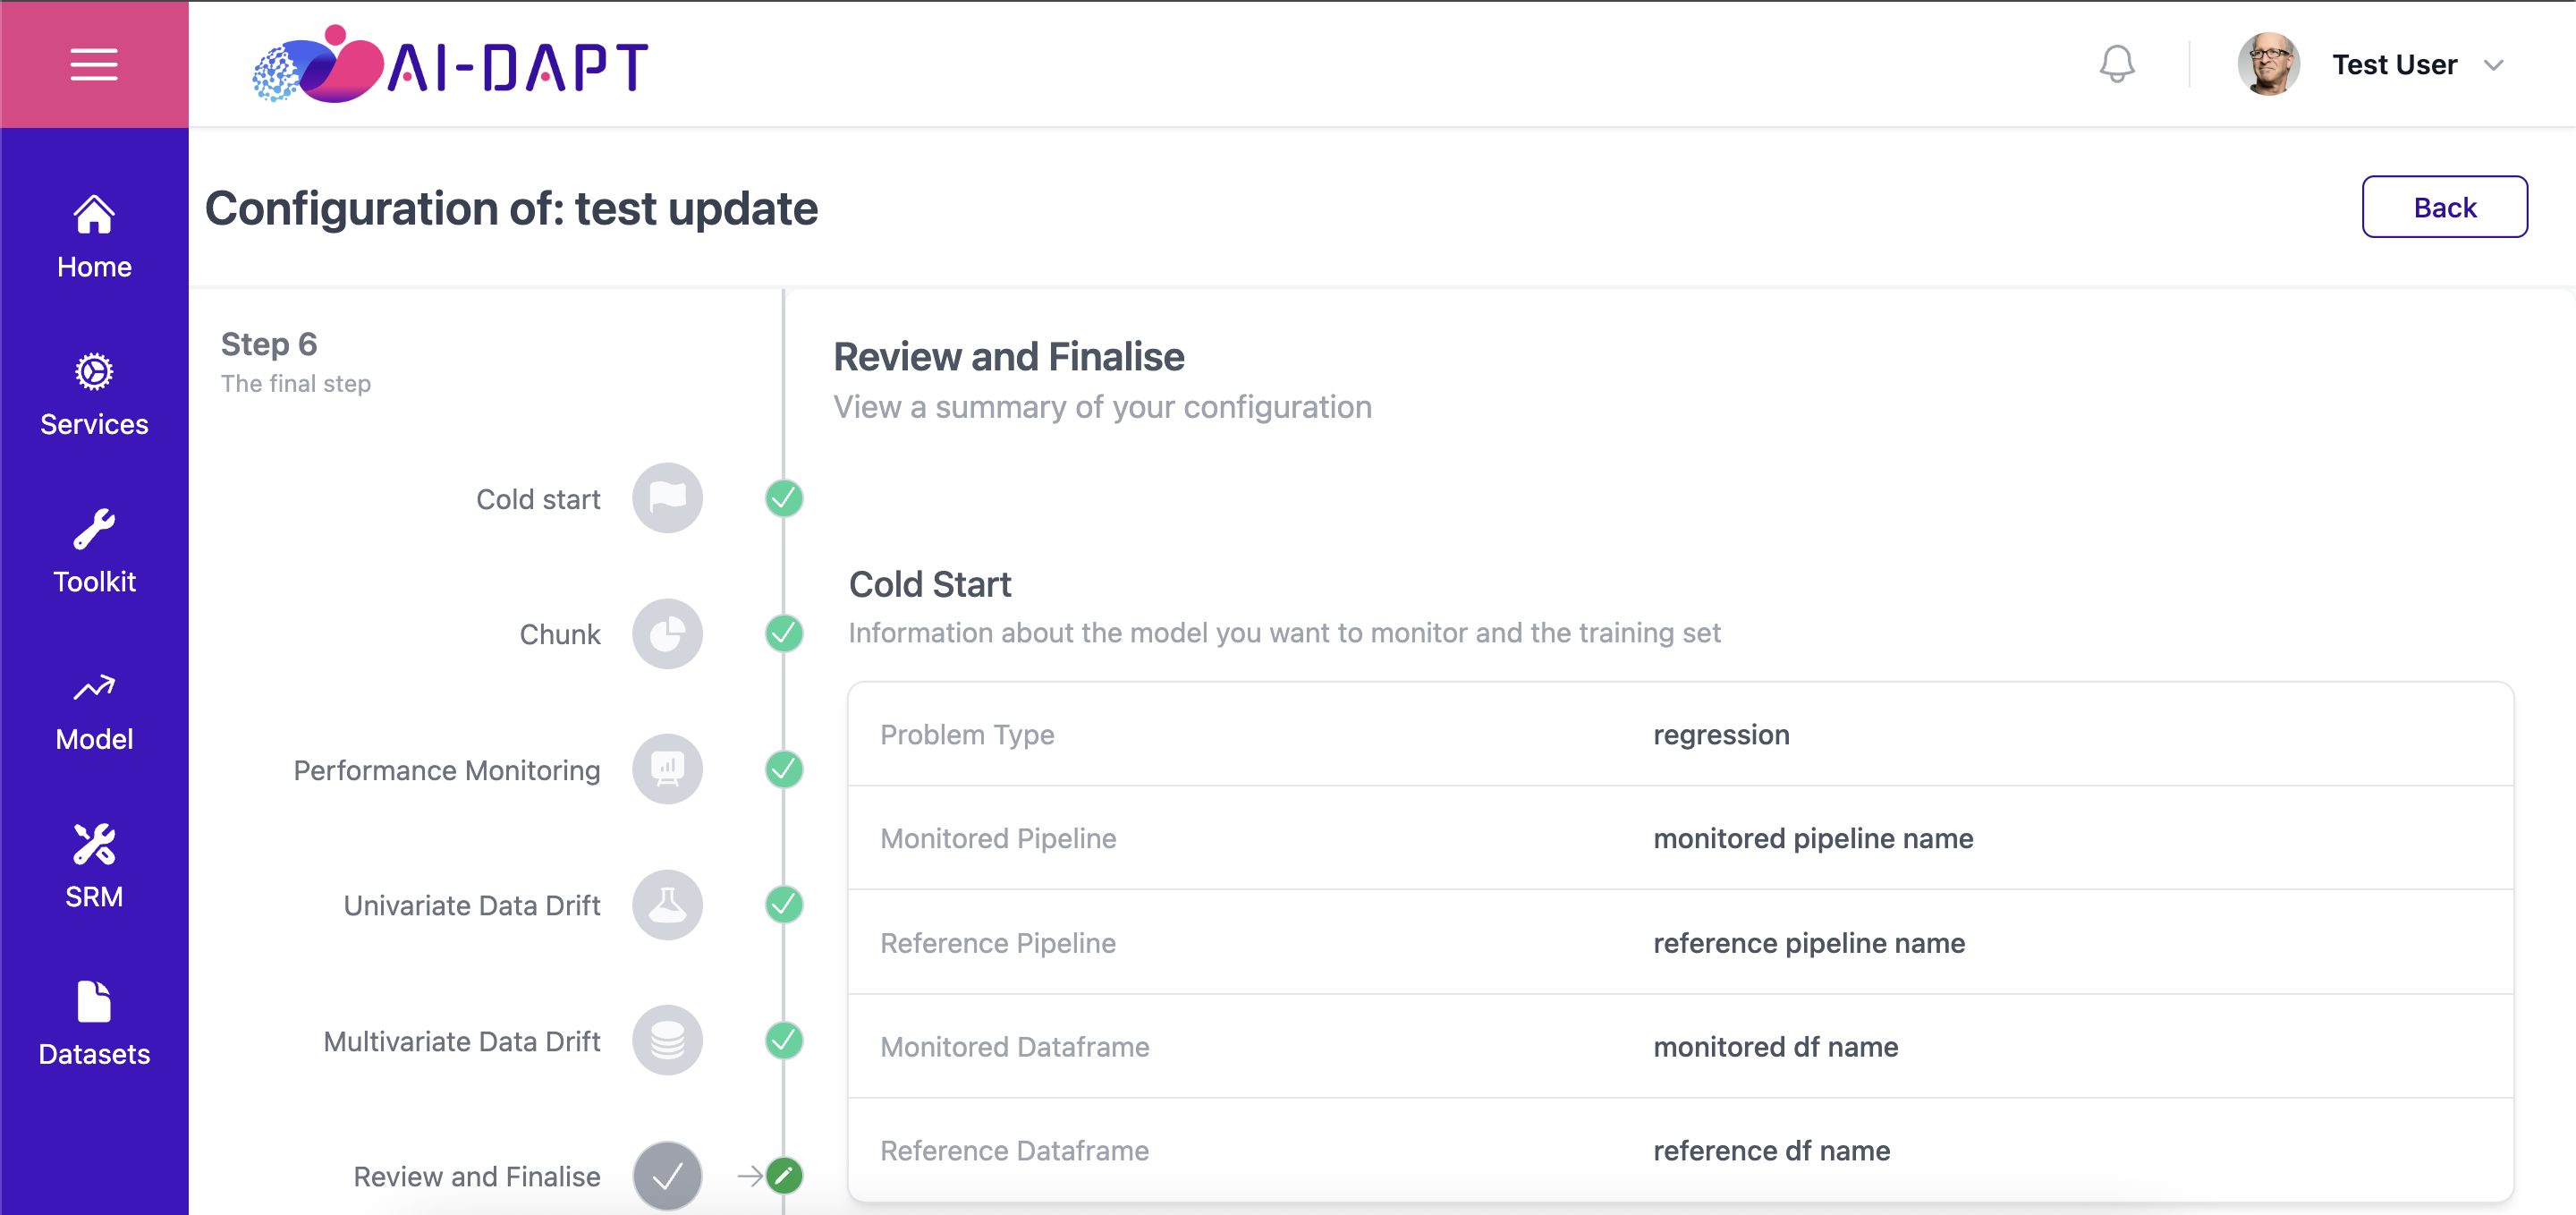
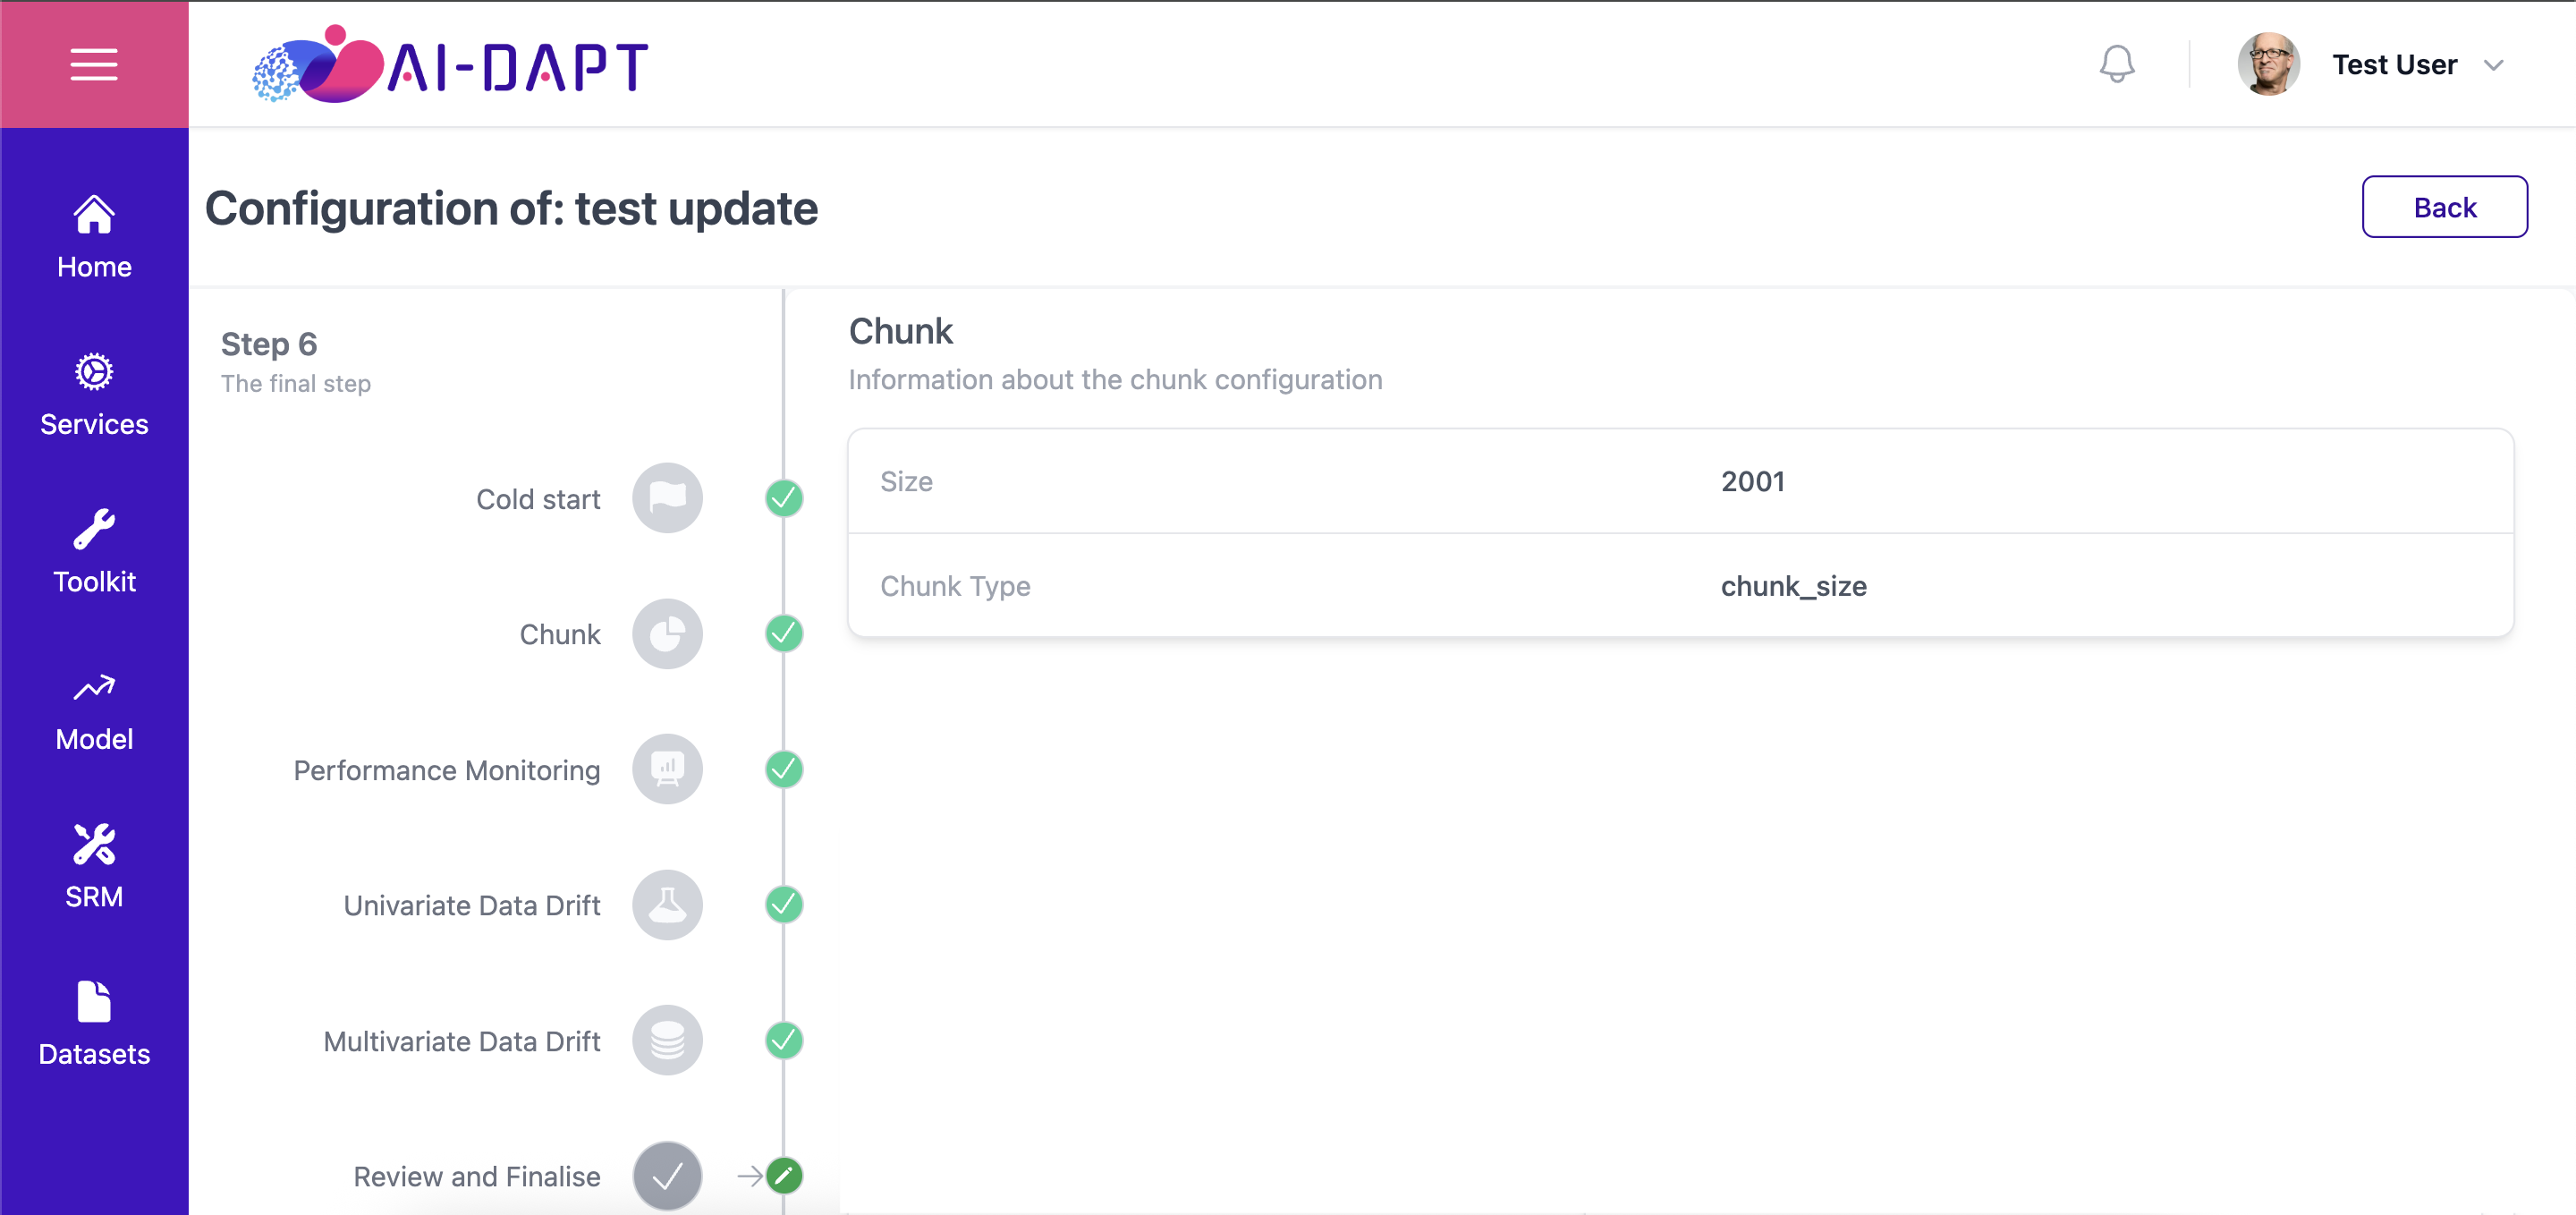
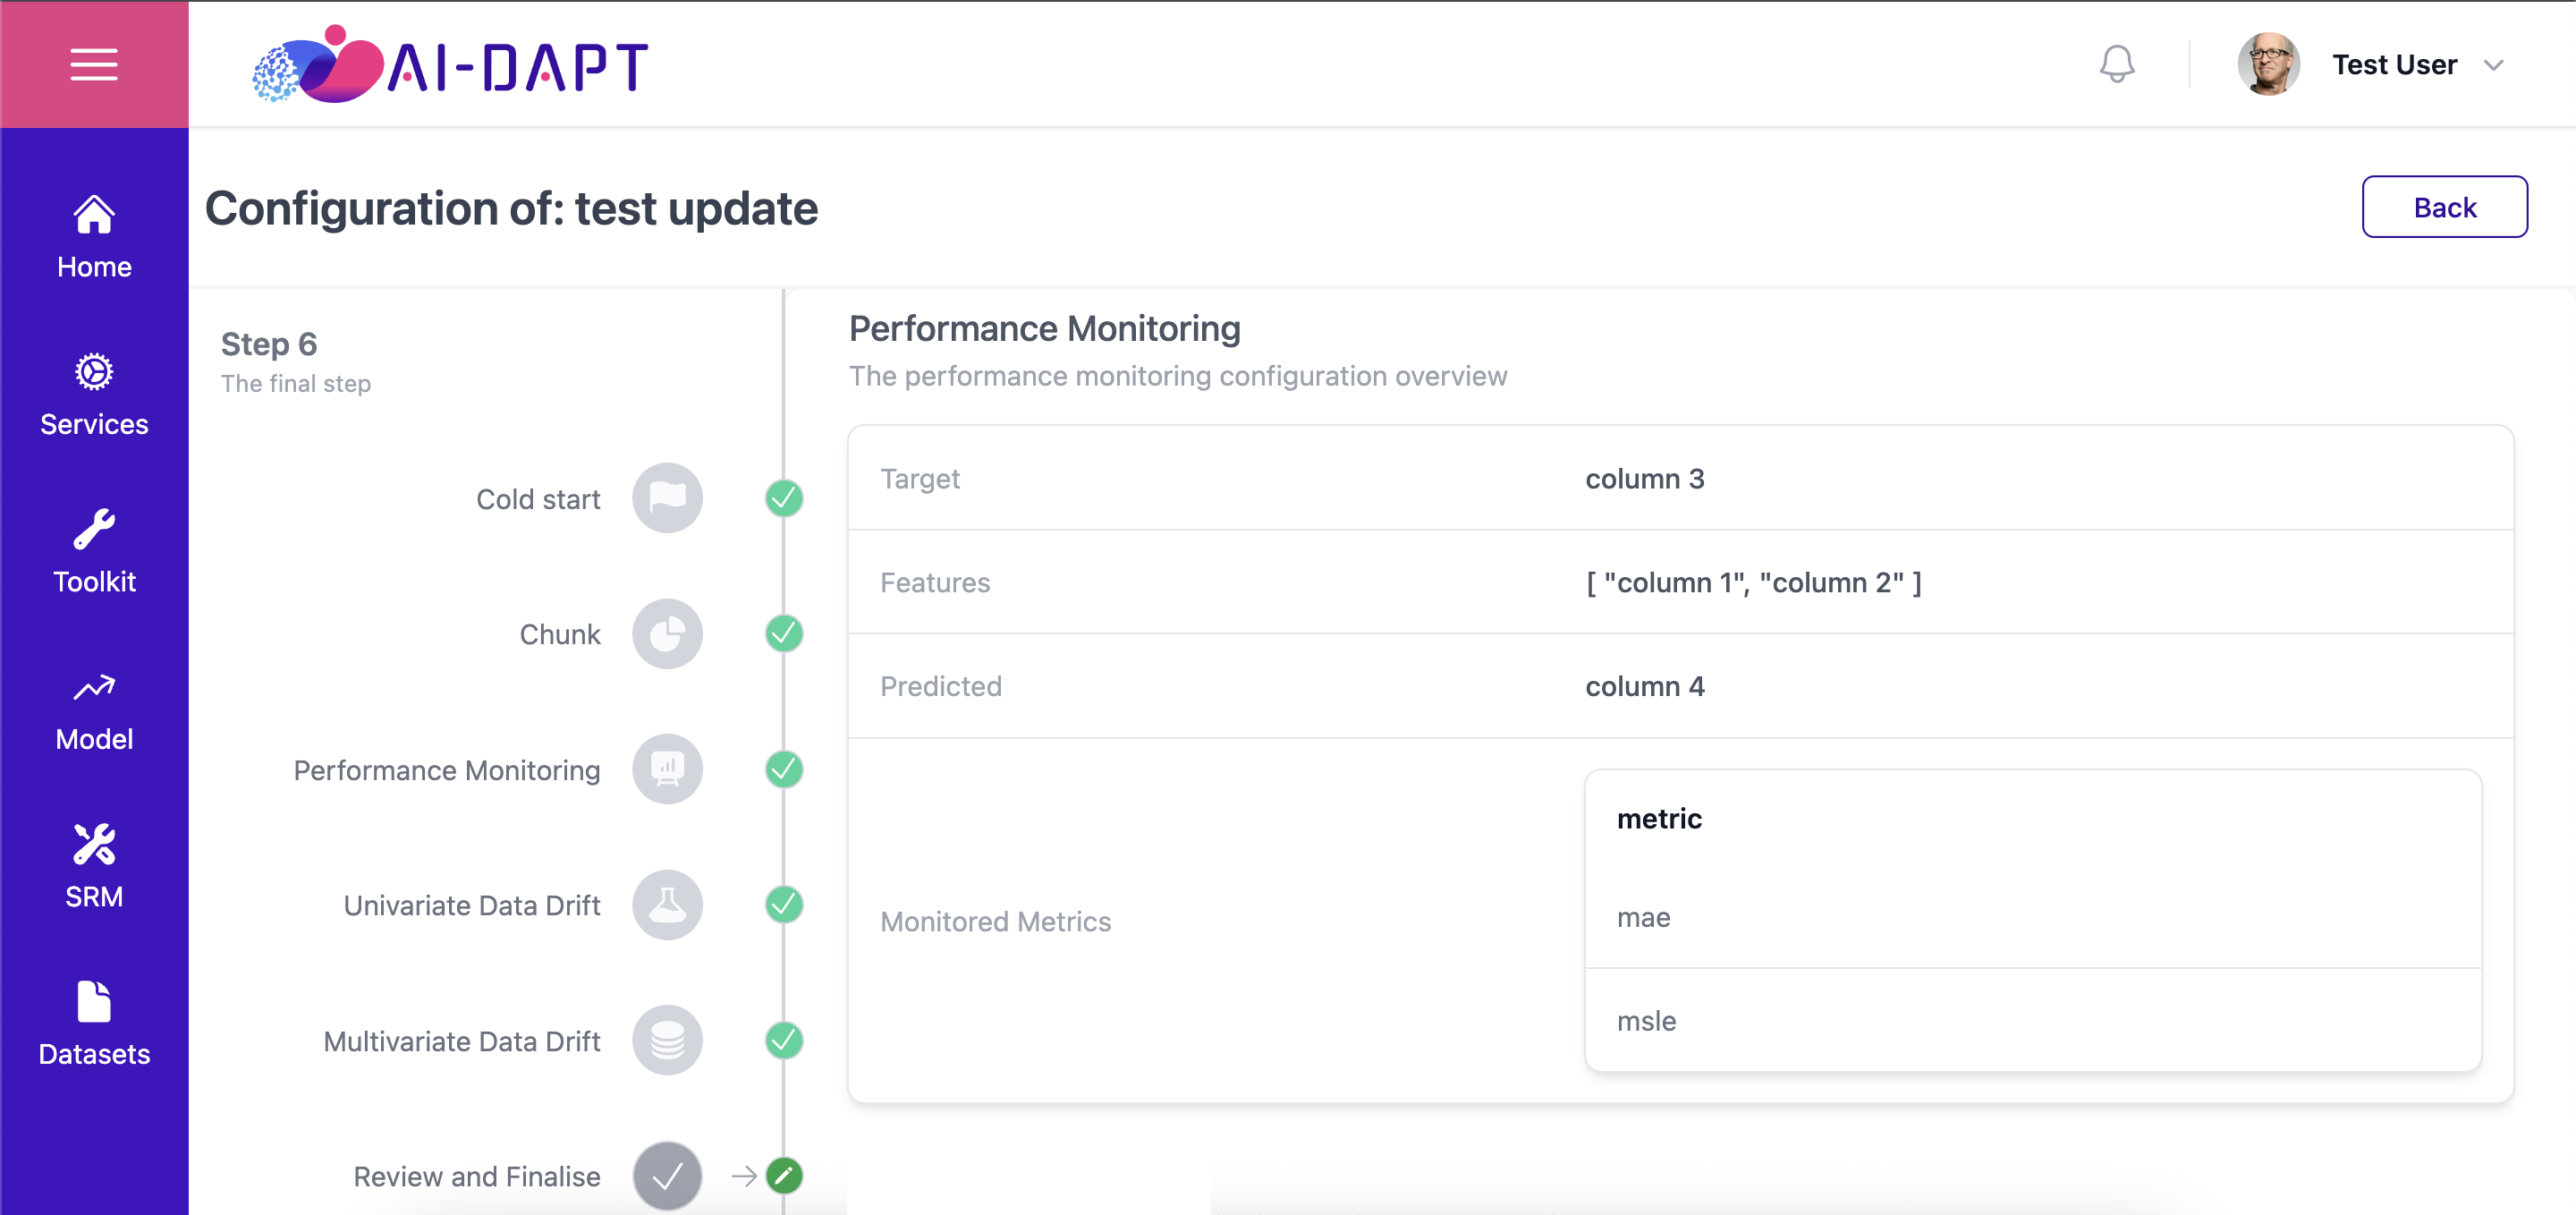
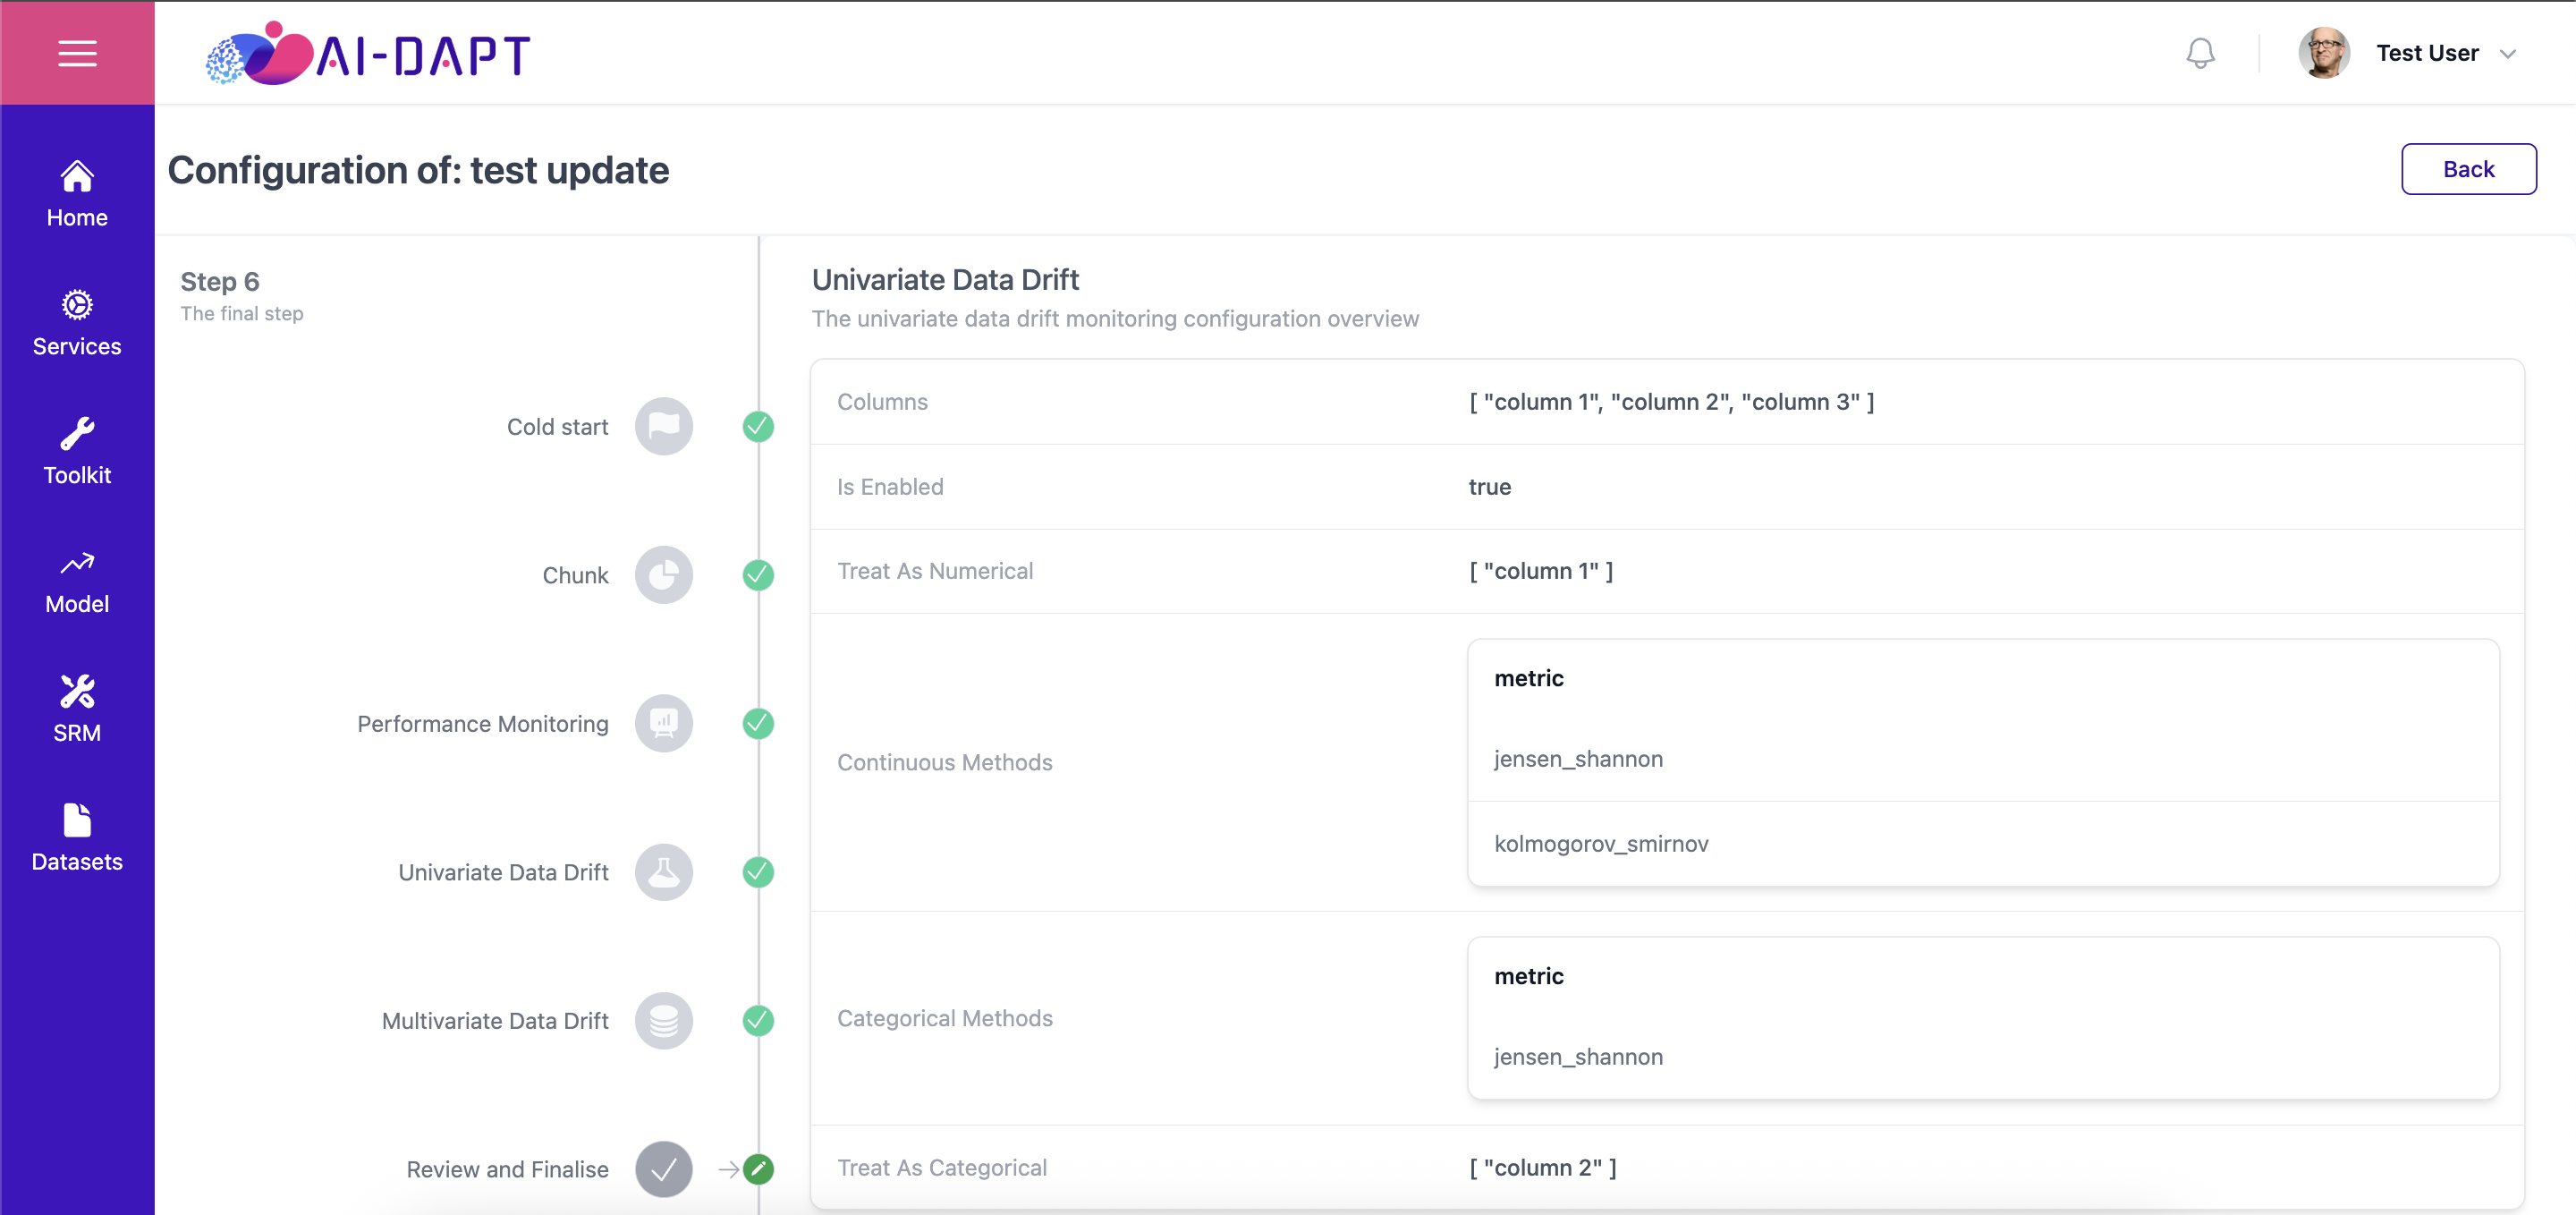
Review And Finalise - Multivariate Data Drift
Prev |