Getting Familiar
Project Dashboard
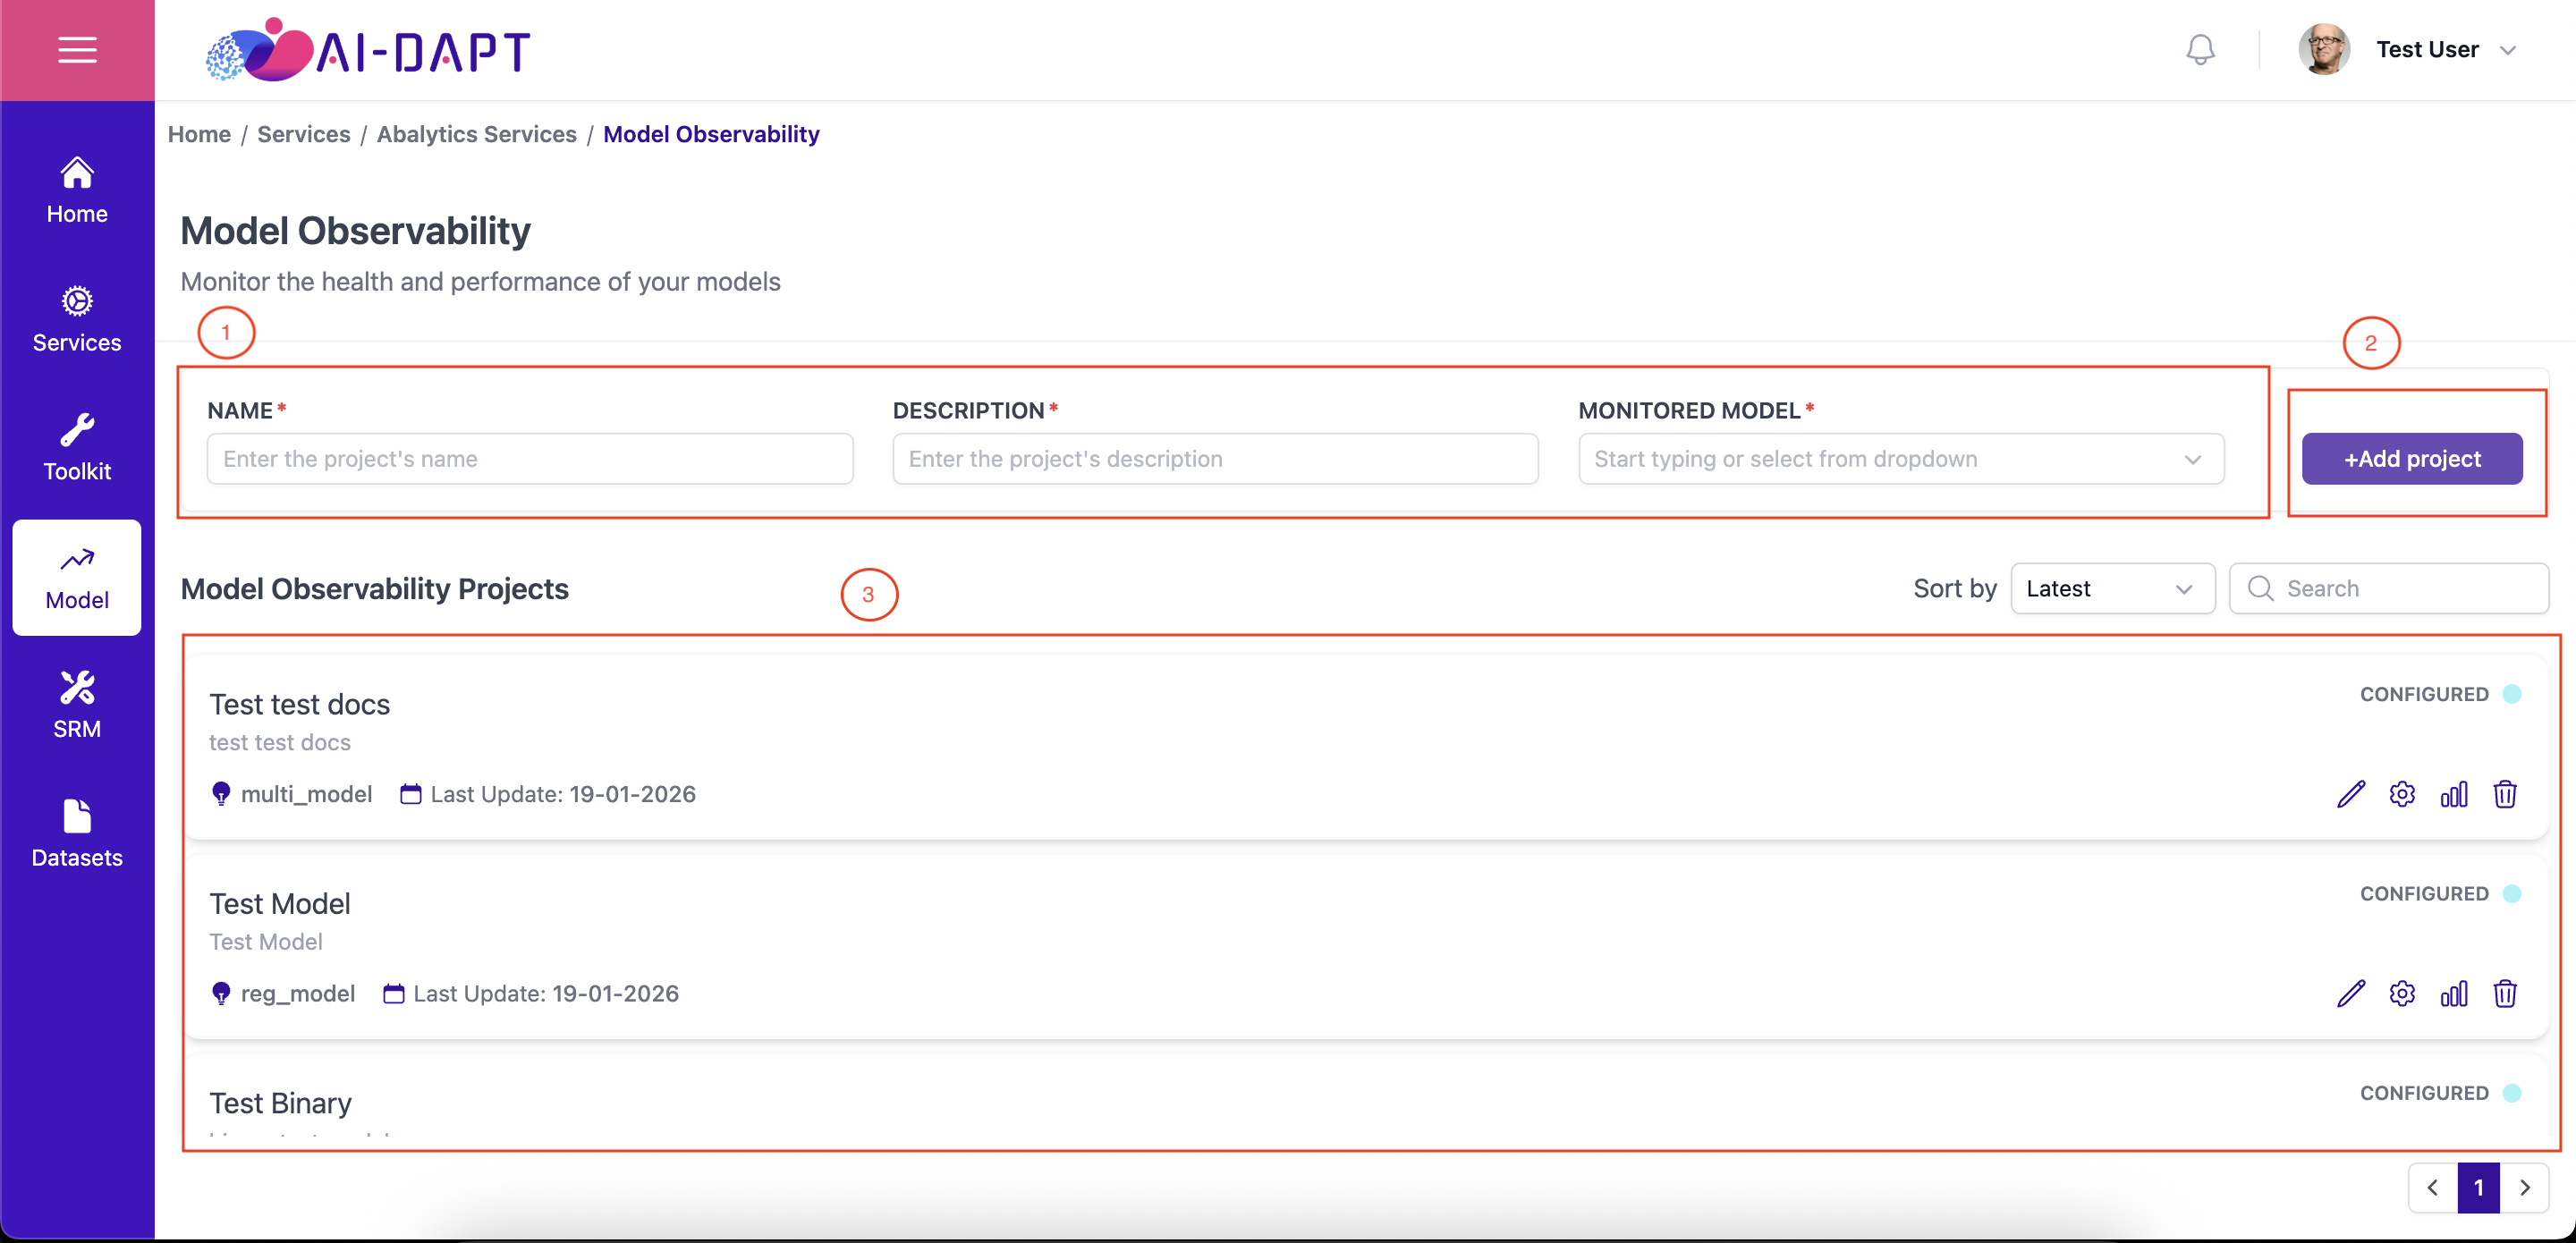
The Project Dashboard is your starting point for managing model health.
-
Project Registration Form: Complete all required fields, including model type and data source.
-
Action Button: Click Add Project to initialize your observability workspace.
-
Project Gallery: A list of all active projects you have created.
|
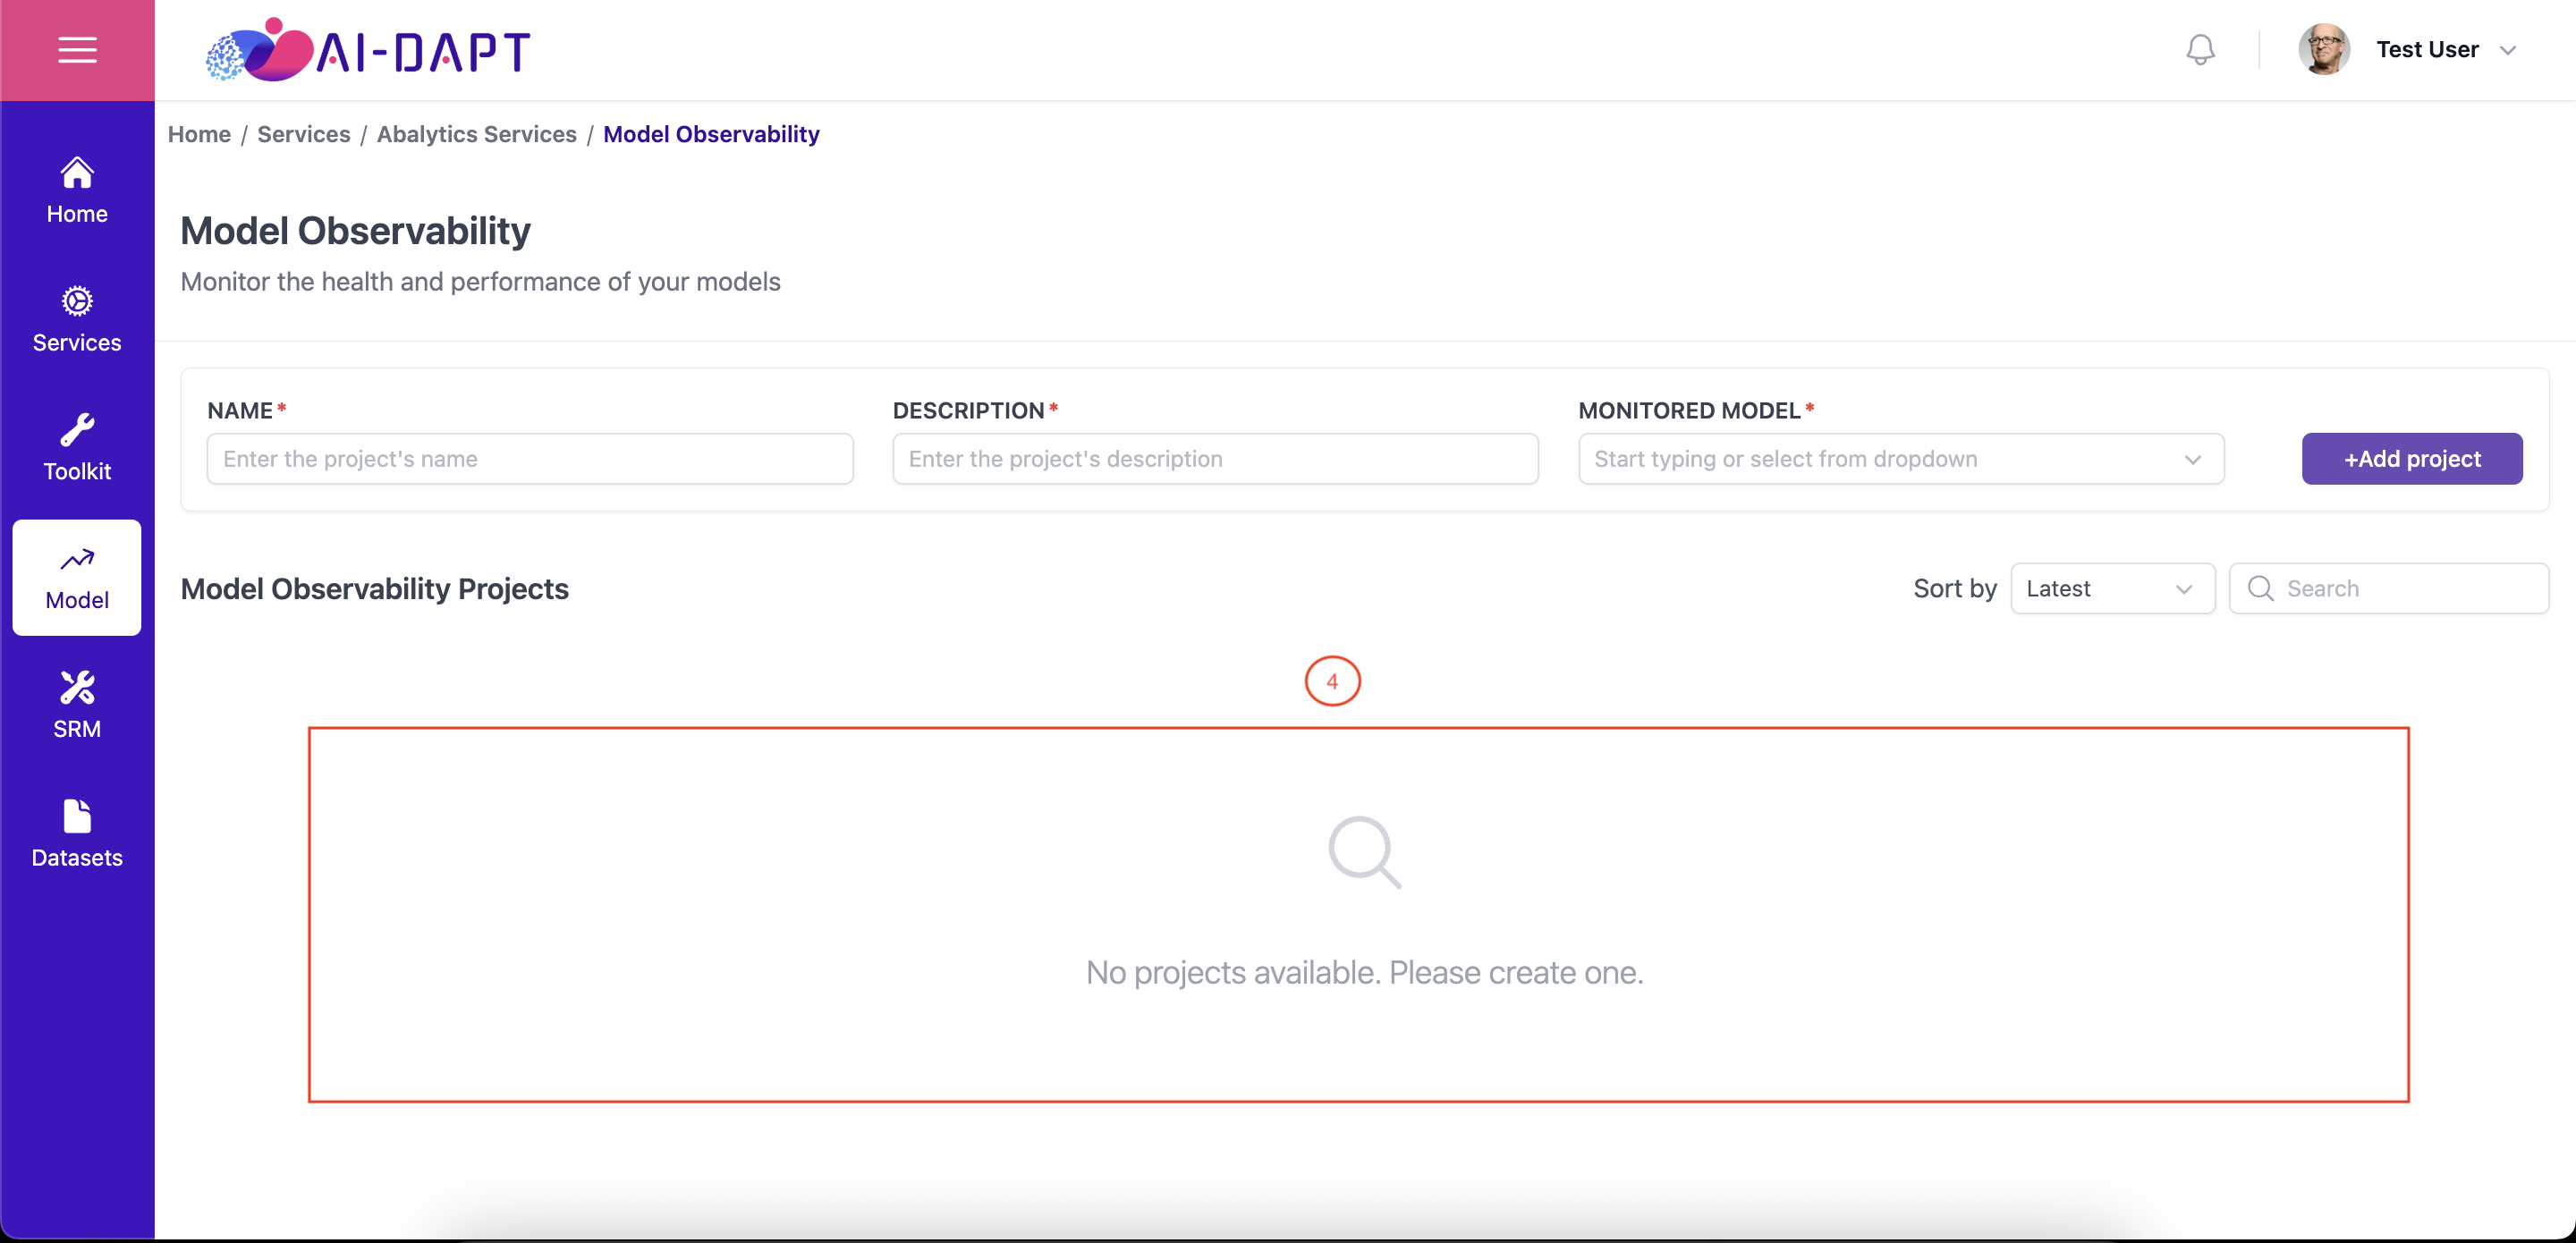
If you haven’t created any projects yet, you will see the empty state illustrated below. |
Project Card
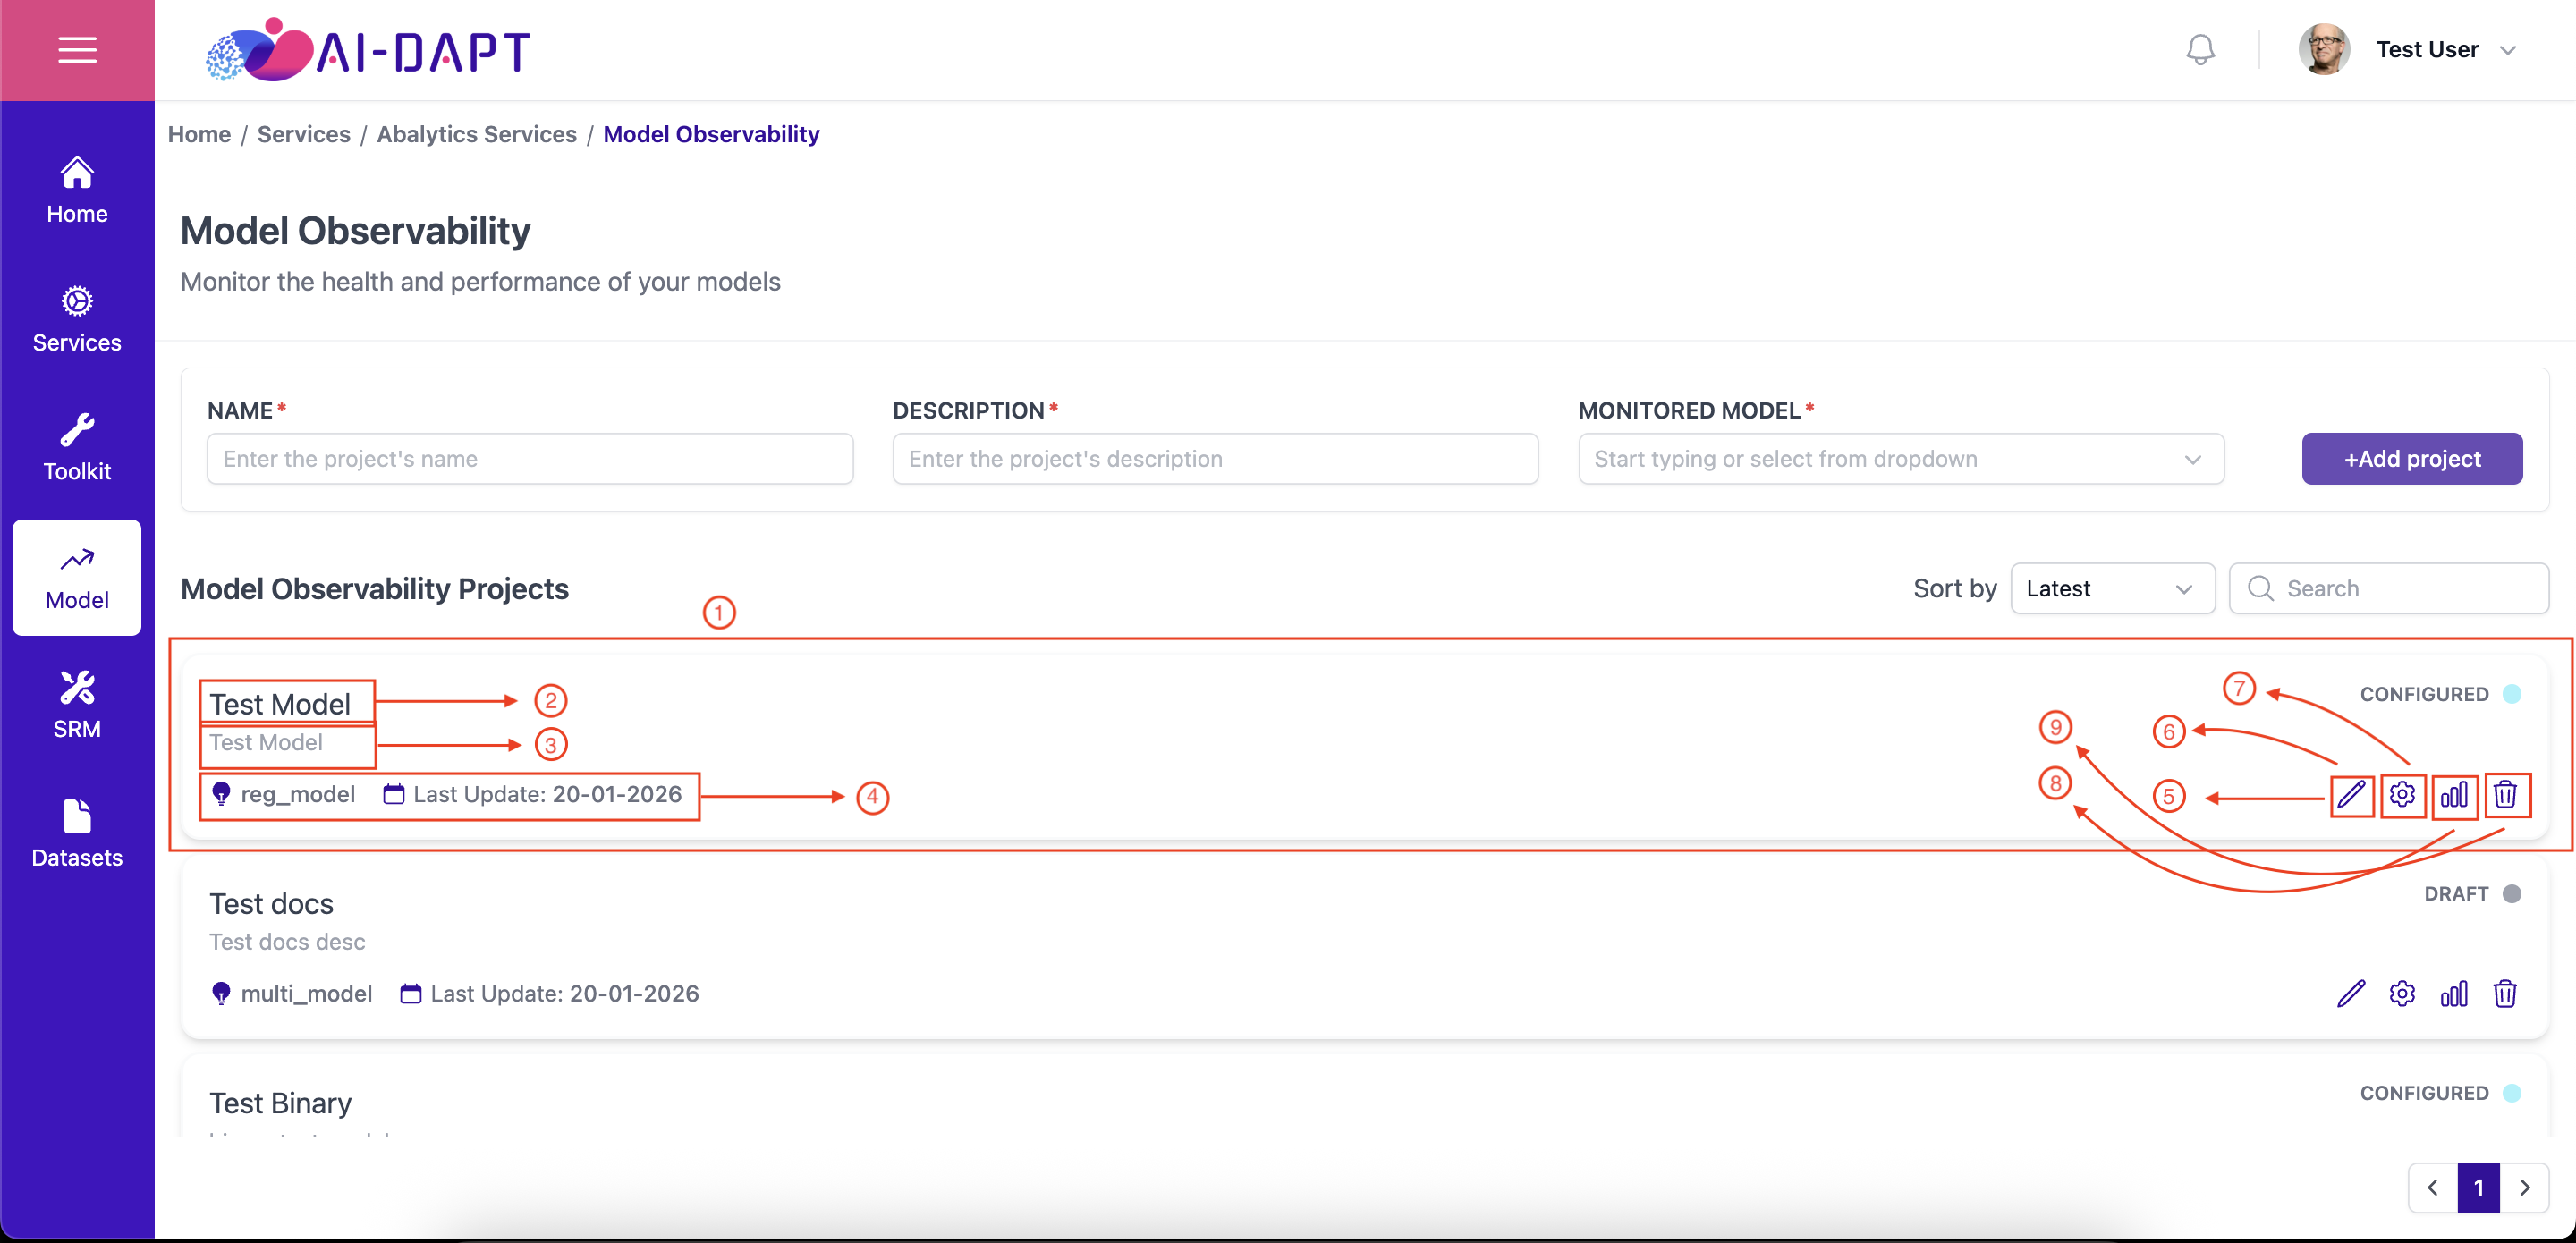
The Project Card provides a high-level overview of a specific model’s health, configuration status, and management options at a glance.
-
Project List Area: The primary container displaying all registered observability projects.
-
Project Name: The display name assigned during project creation.
-
Project Description: A short summary providing context for the model’s use case.
-
Model ID & Timestamp: Displays the specific registered model name and the date of the last data update.
-
Edit Project: Opens the configuration form to update project metadata.
-
Settings: Access advanced monitoring thresholds and alert configurations.
-
View Analytics: Deep-dive into drift metrics, performance graphs, and explainability reports.
-
Delete Project: Permanently removes the project and its historical monitoring data.
|
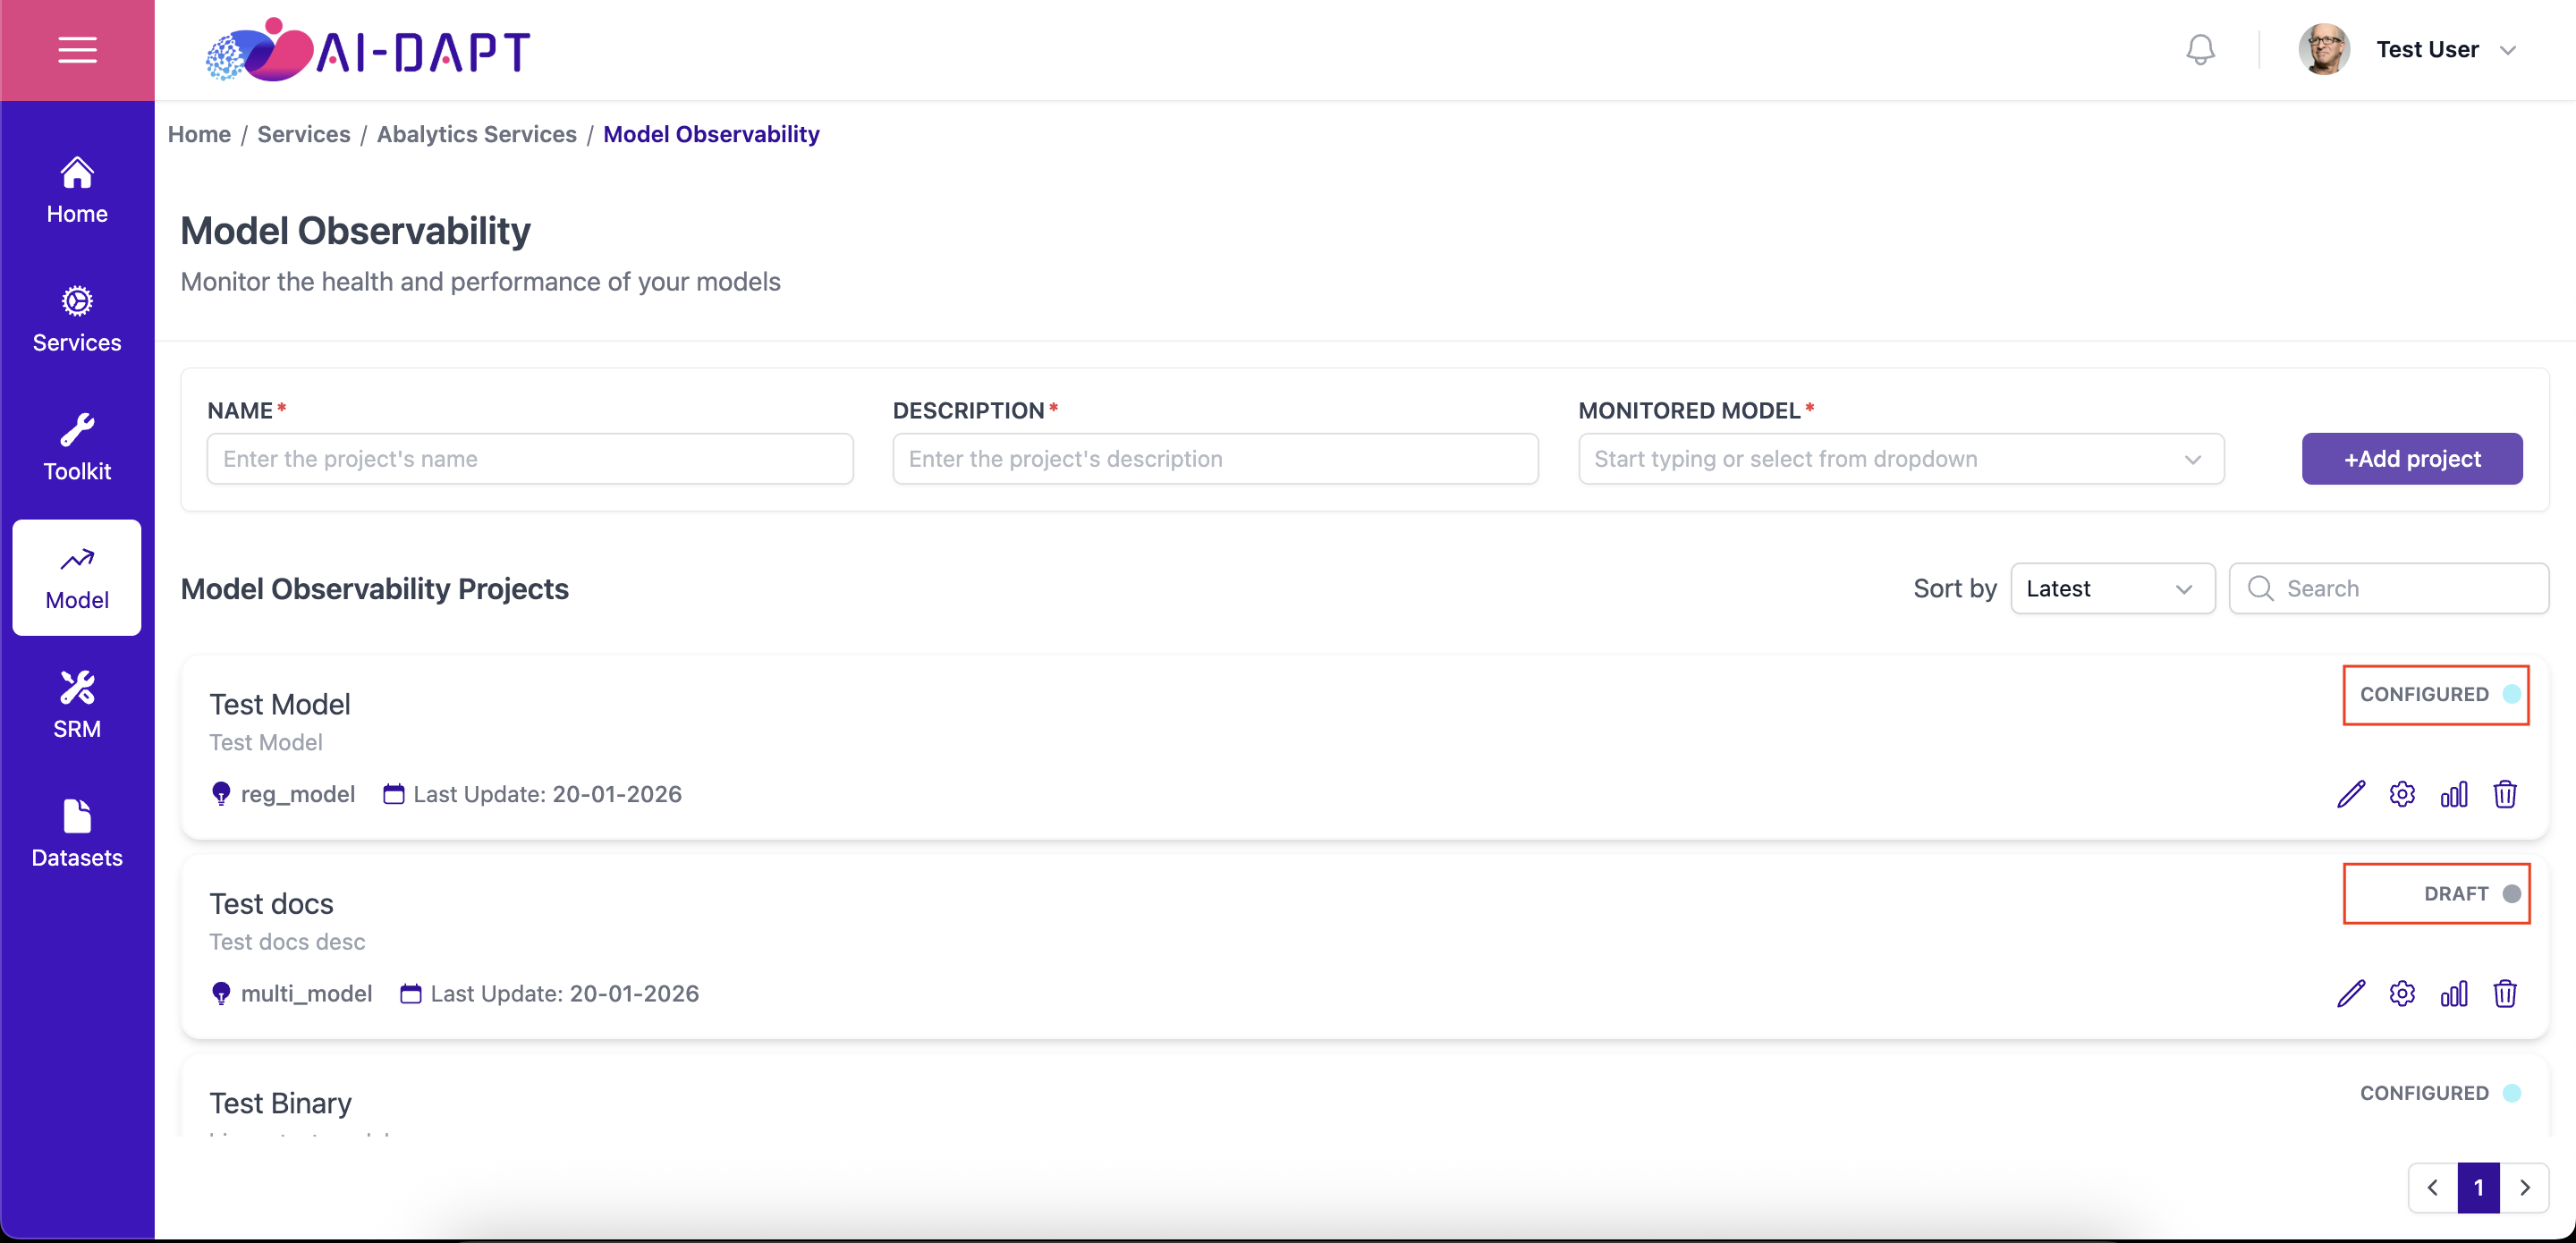
The Status Indicator (top-right of the card) shows whether a project is currently |
Prev |
Next |