Evaluate your First Project
The Evaluation workspace is a diagnostic environment designed to validate the quality of your synthetic data, by comparing the synthetic output against the original source.
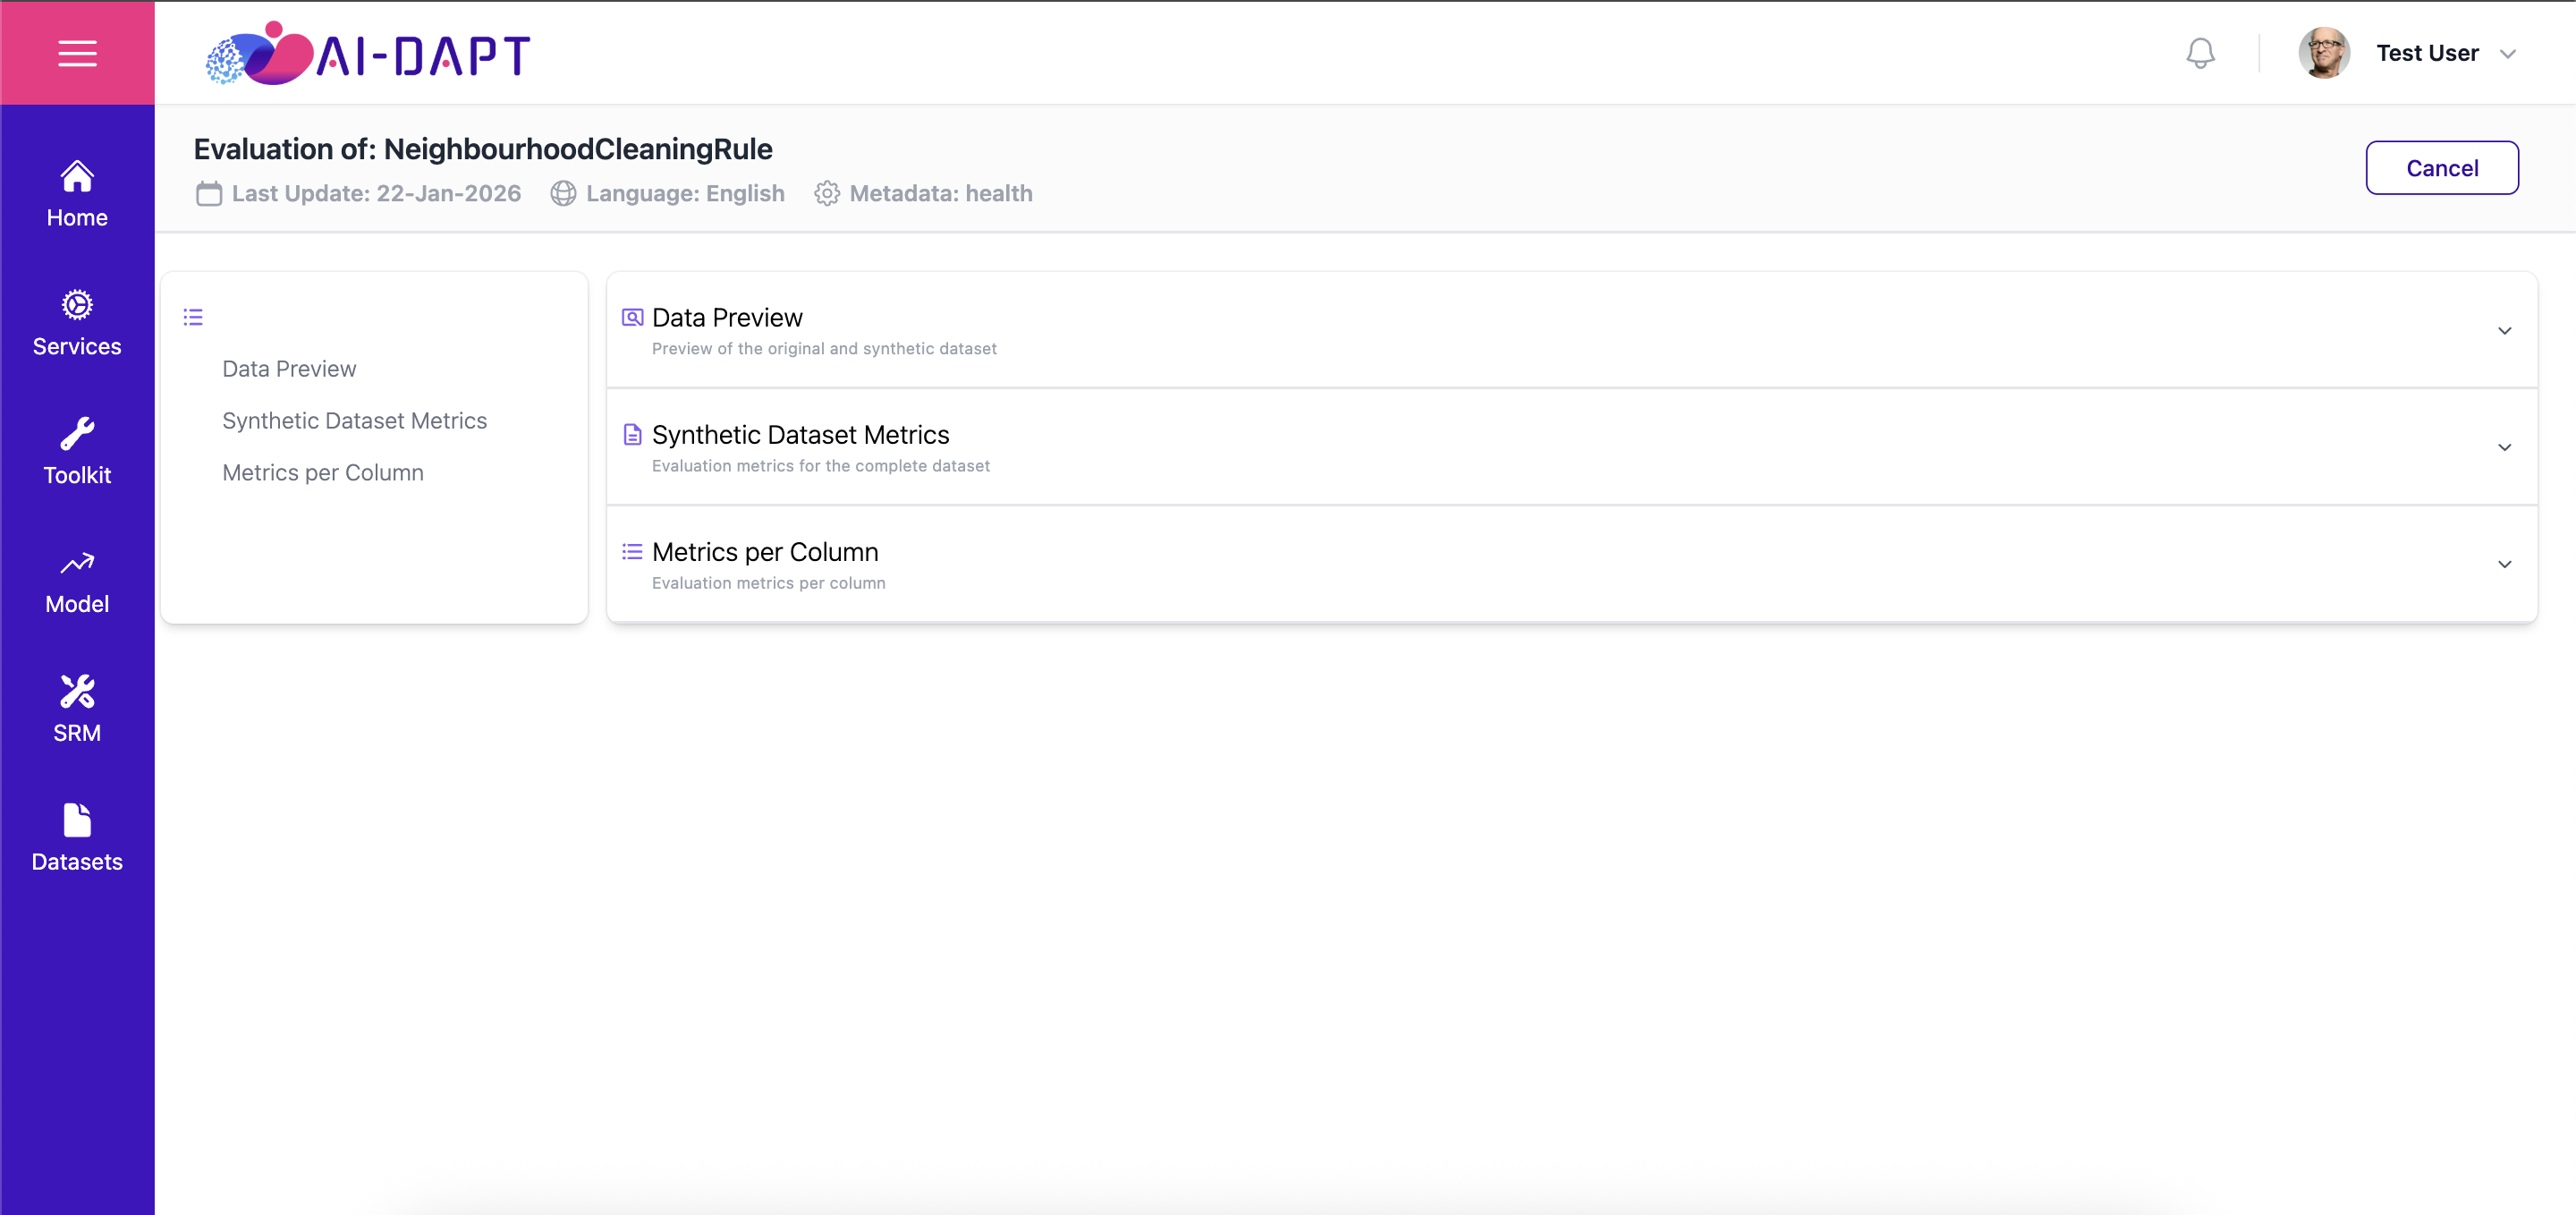
Evaluation Modules
The evaluation process is divided into three specialized modules, accessible via the left-hand navigation menu or the central collapsible panes.
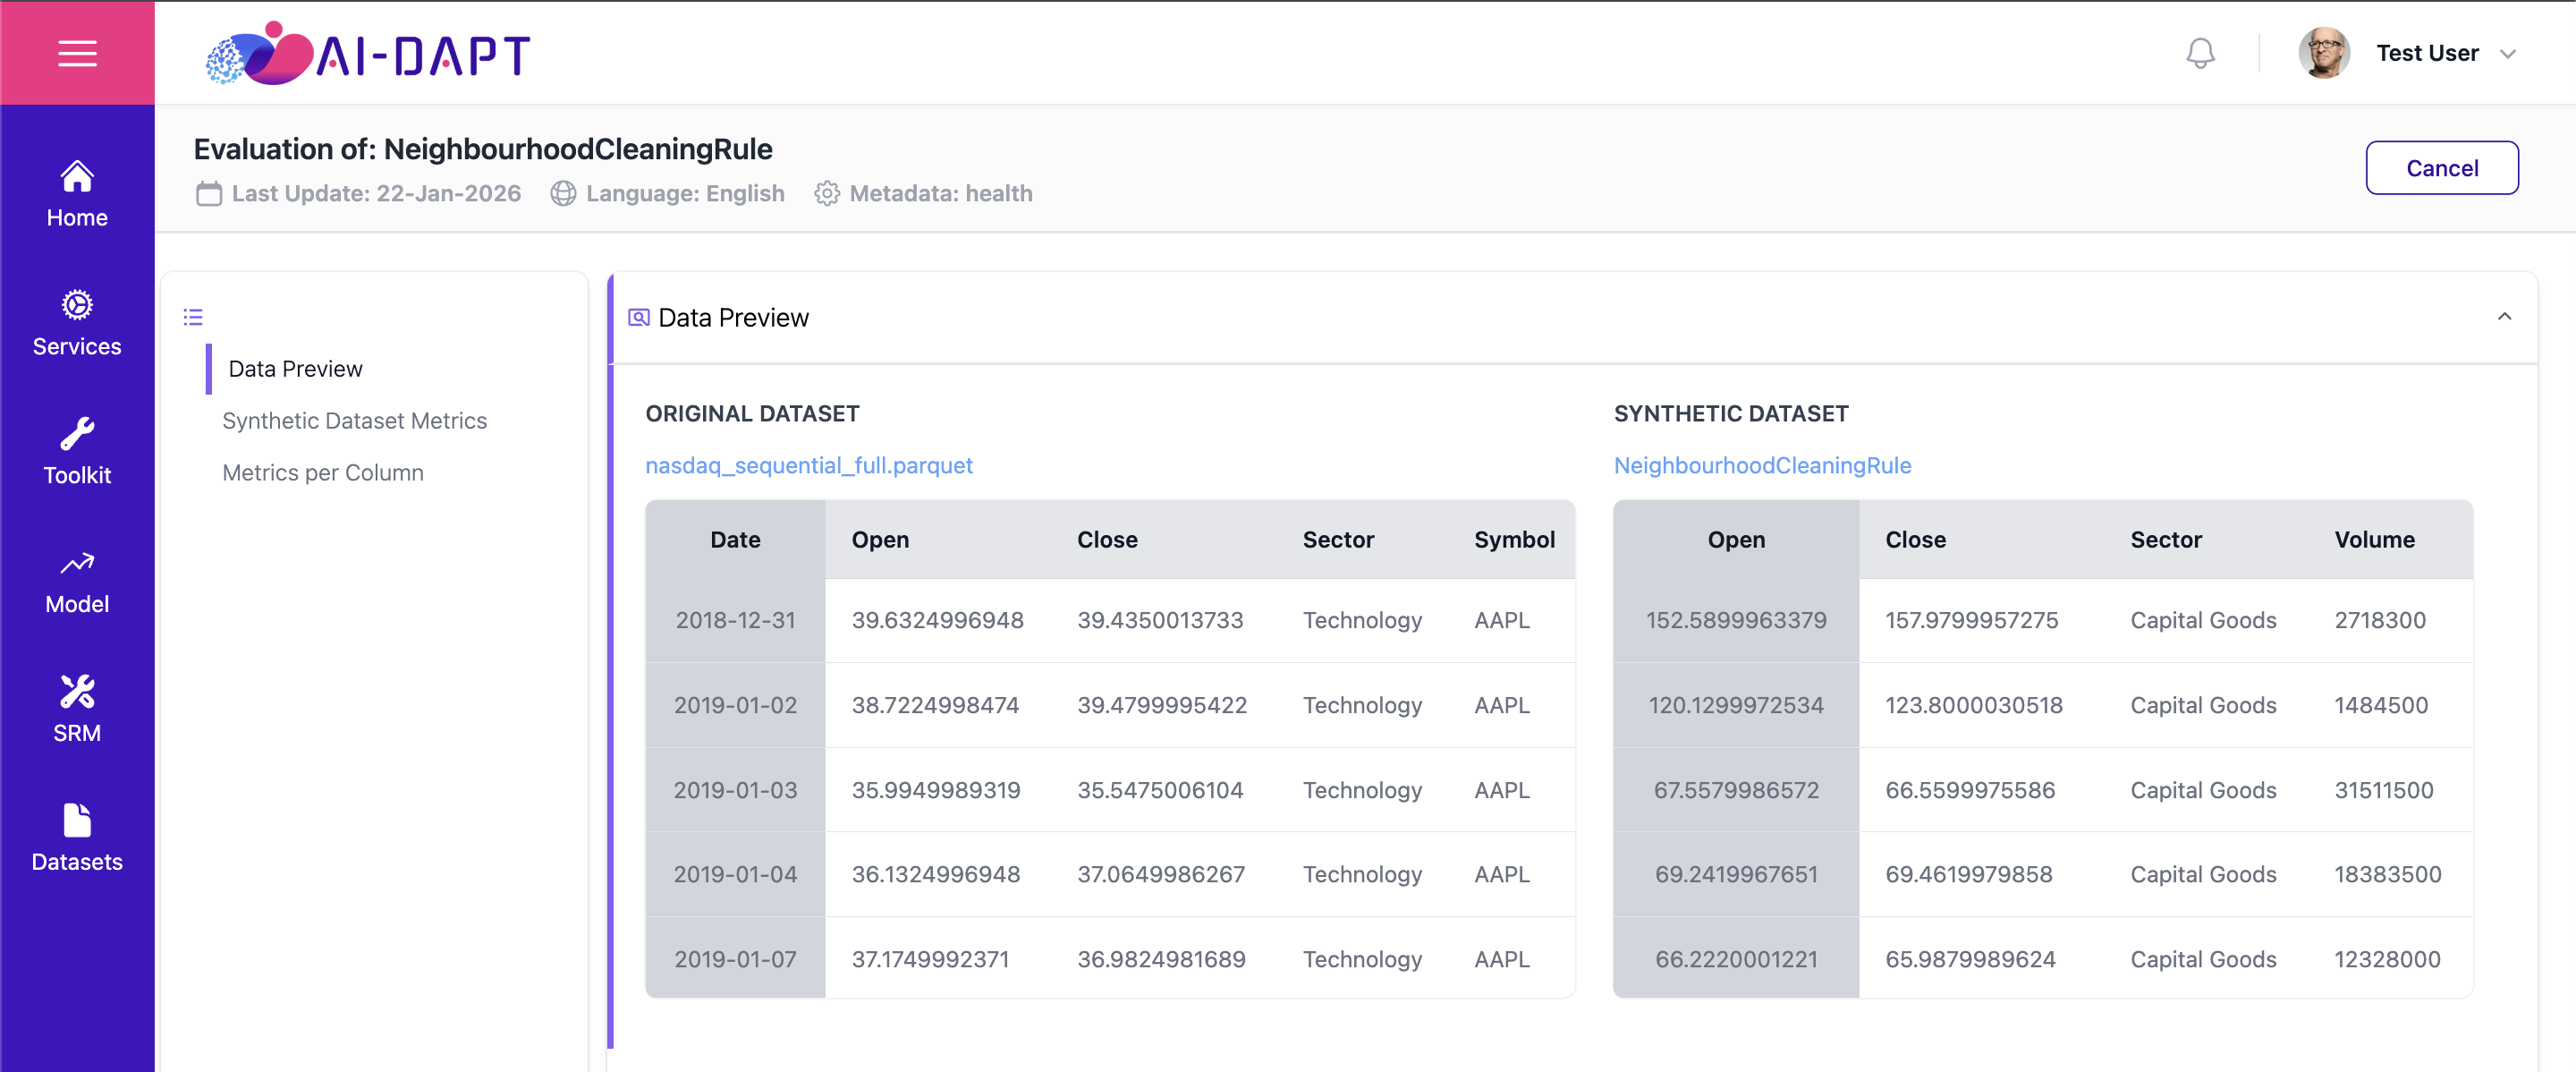
Data Preview
Provides a side-by-side tabular view of the original and synthetic datasets, allowing for direct inspection of raw records.
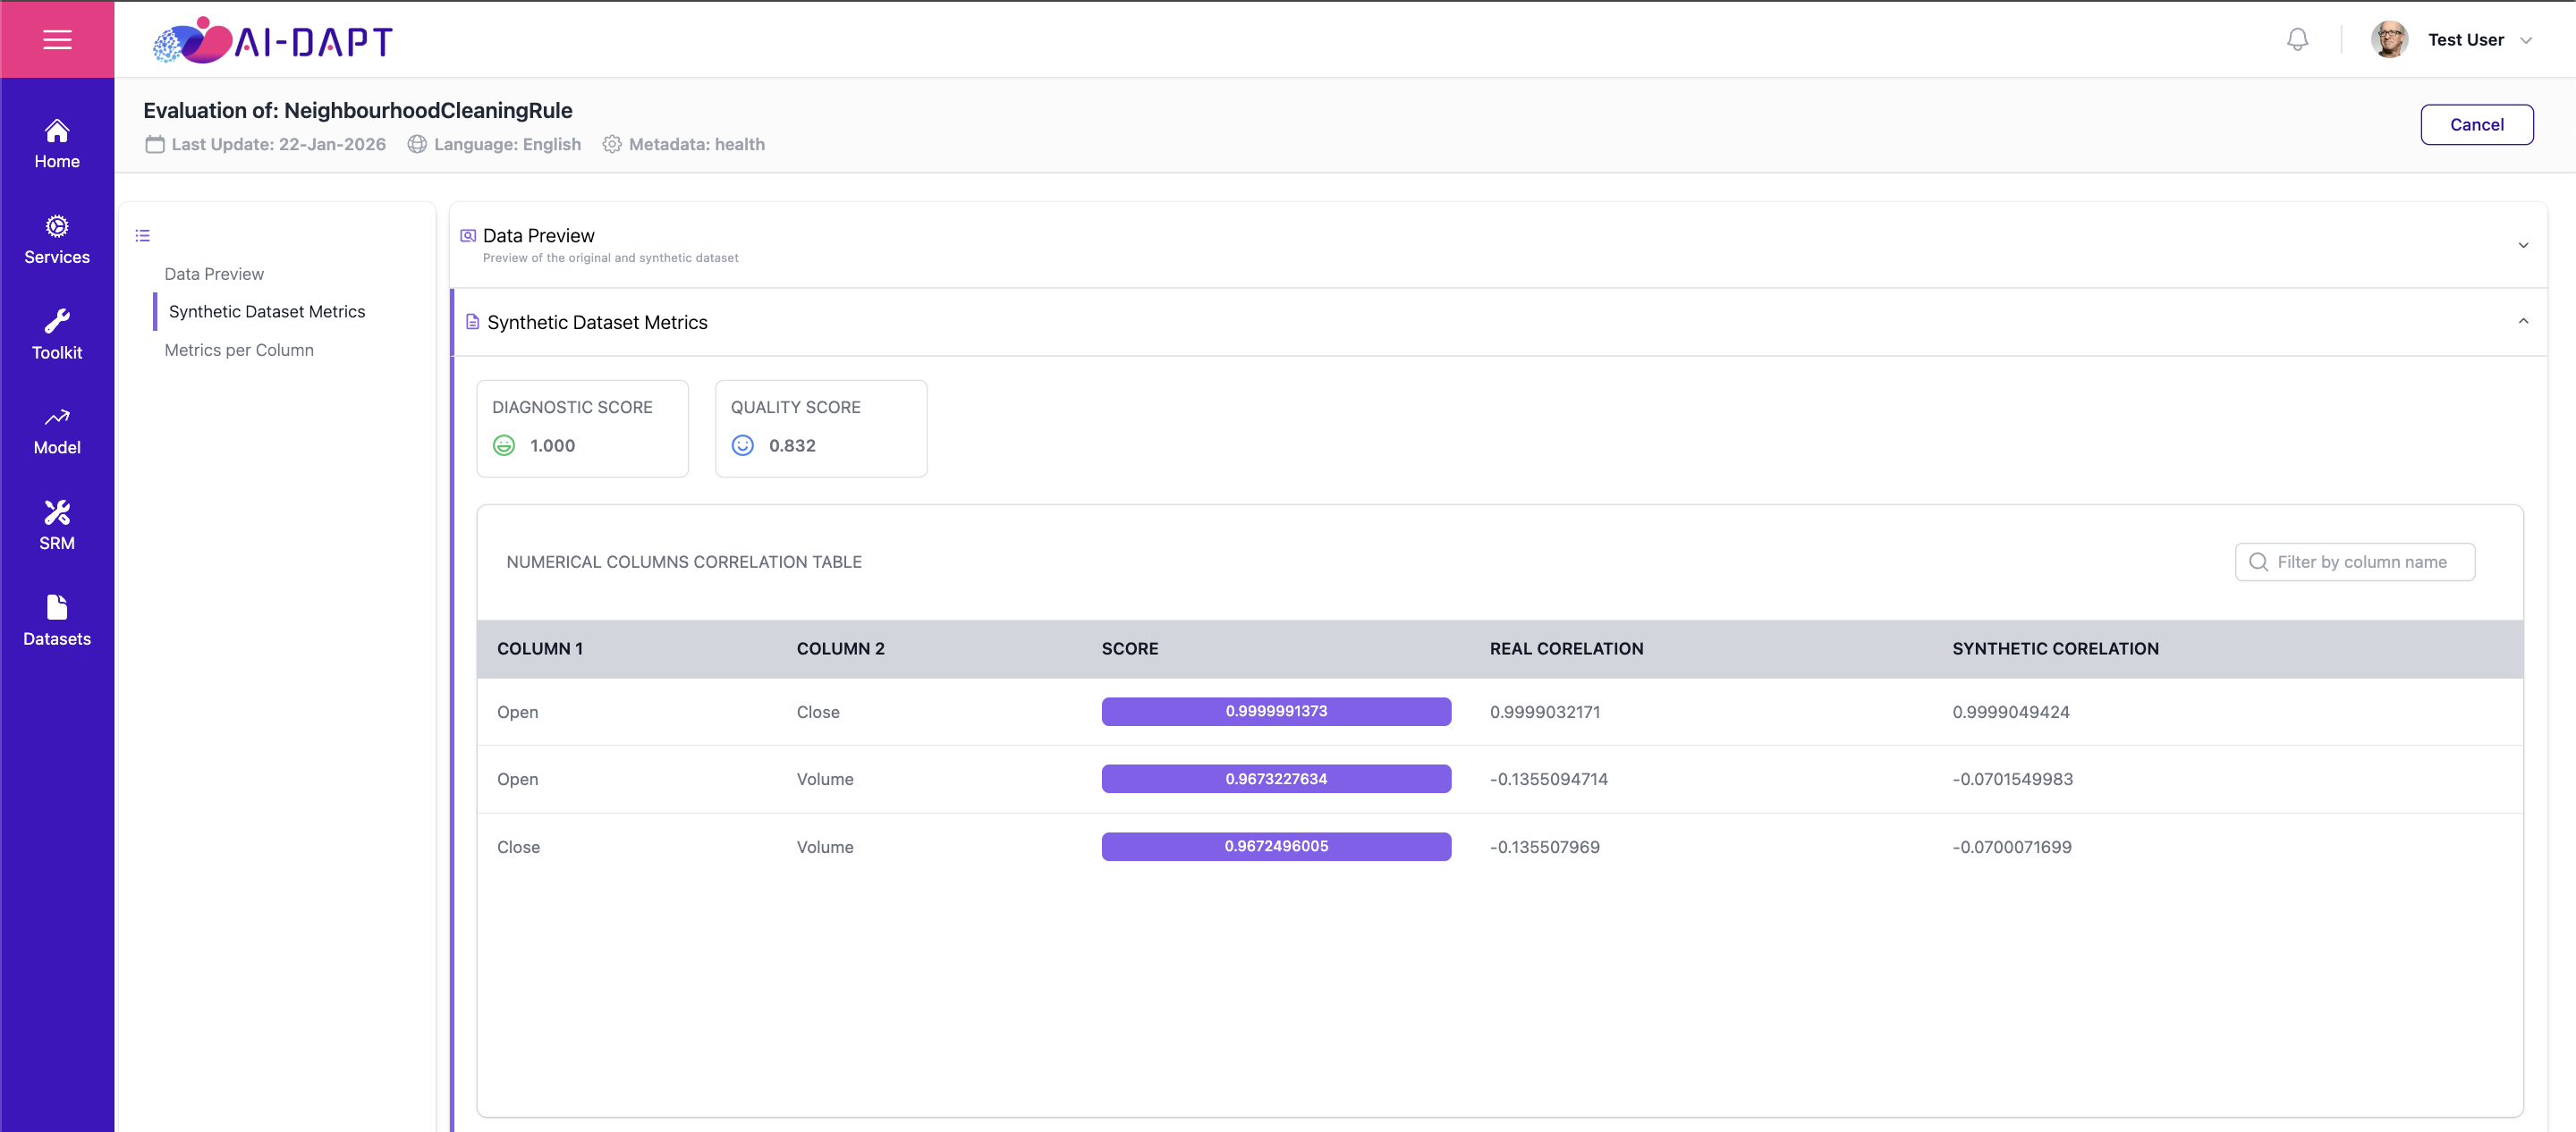
Synthetic Dataset Metrics
Evaluates the statistical similarity between numerical columns, providing high-level diagnostics and a comprehensive quality score for the entire dataset.
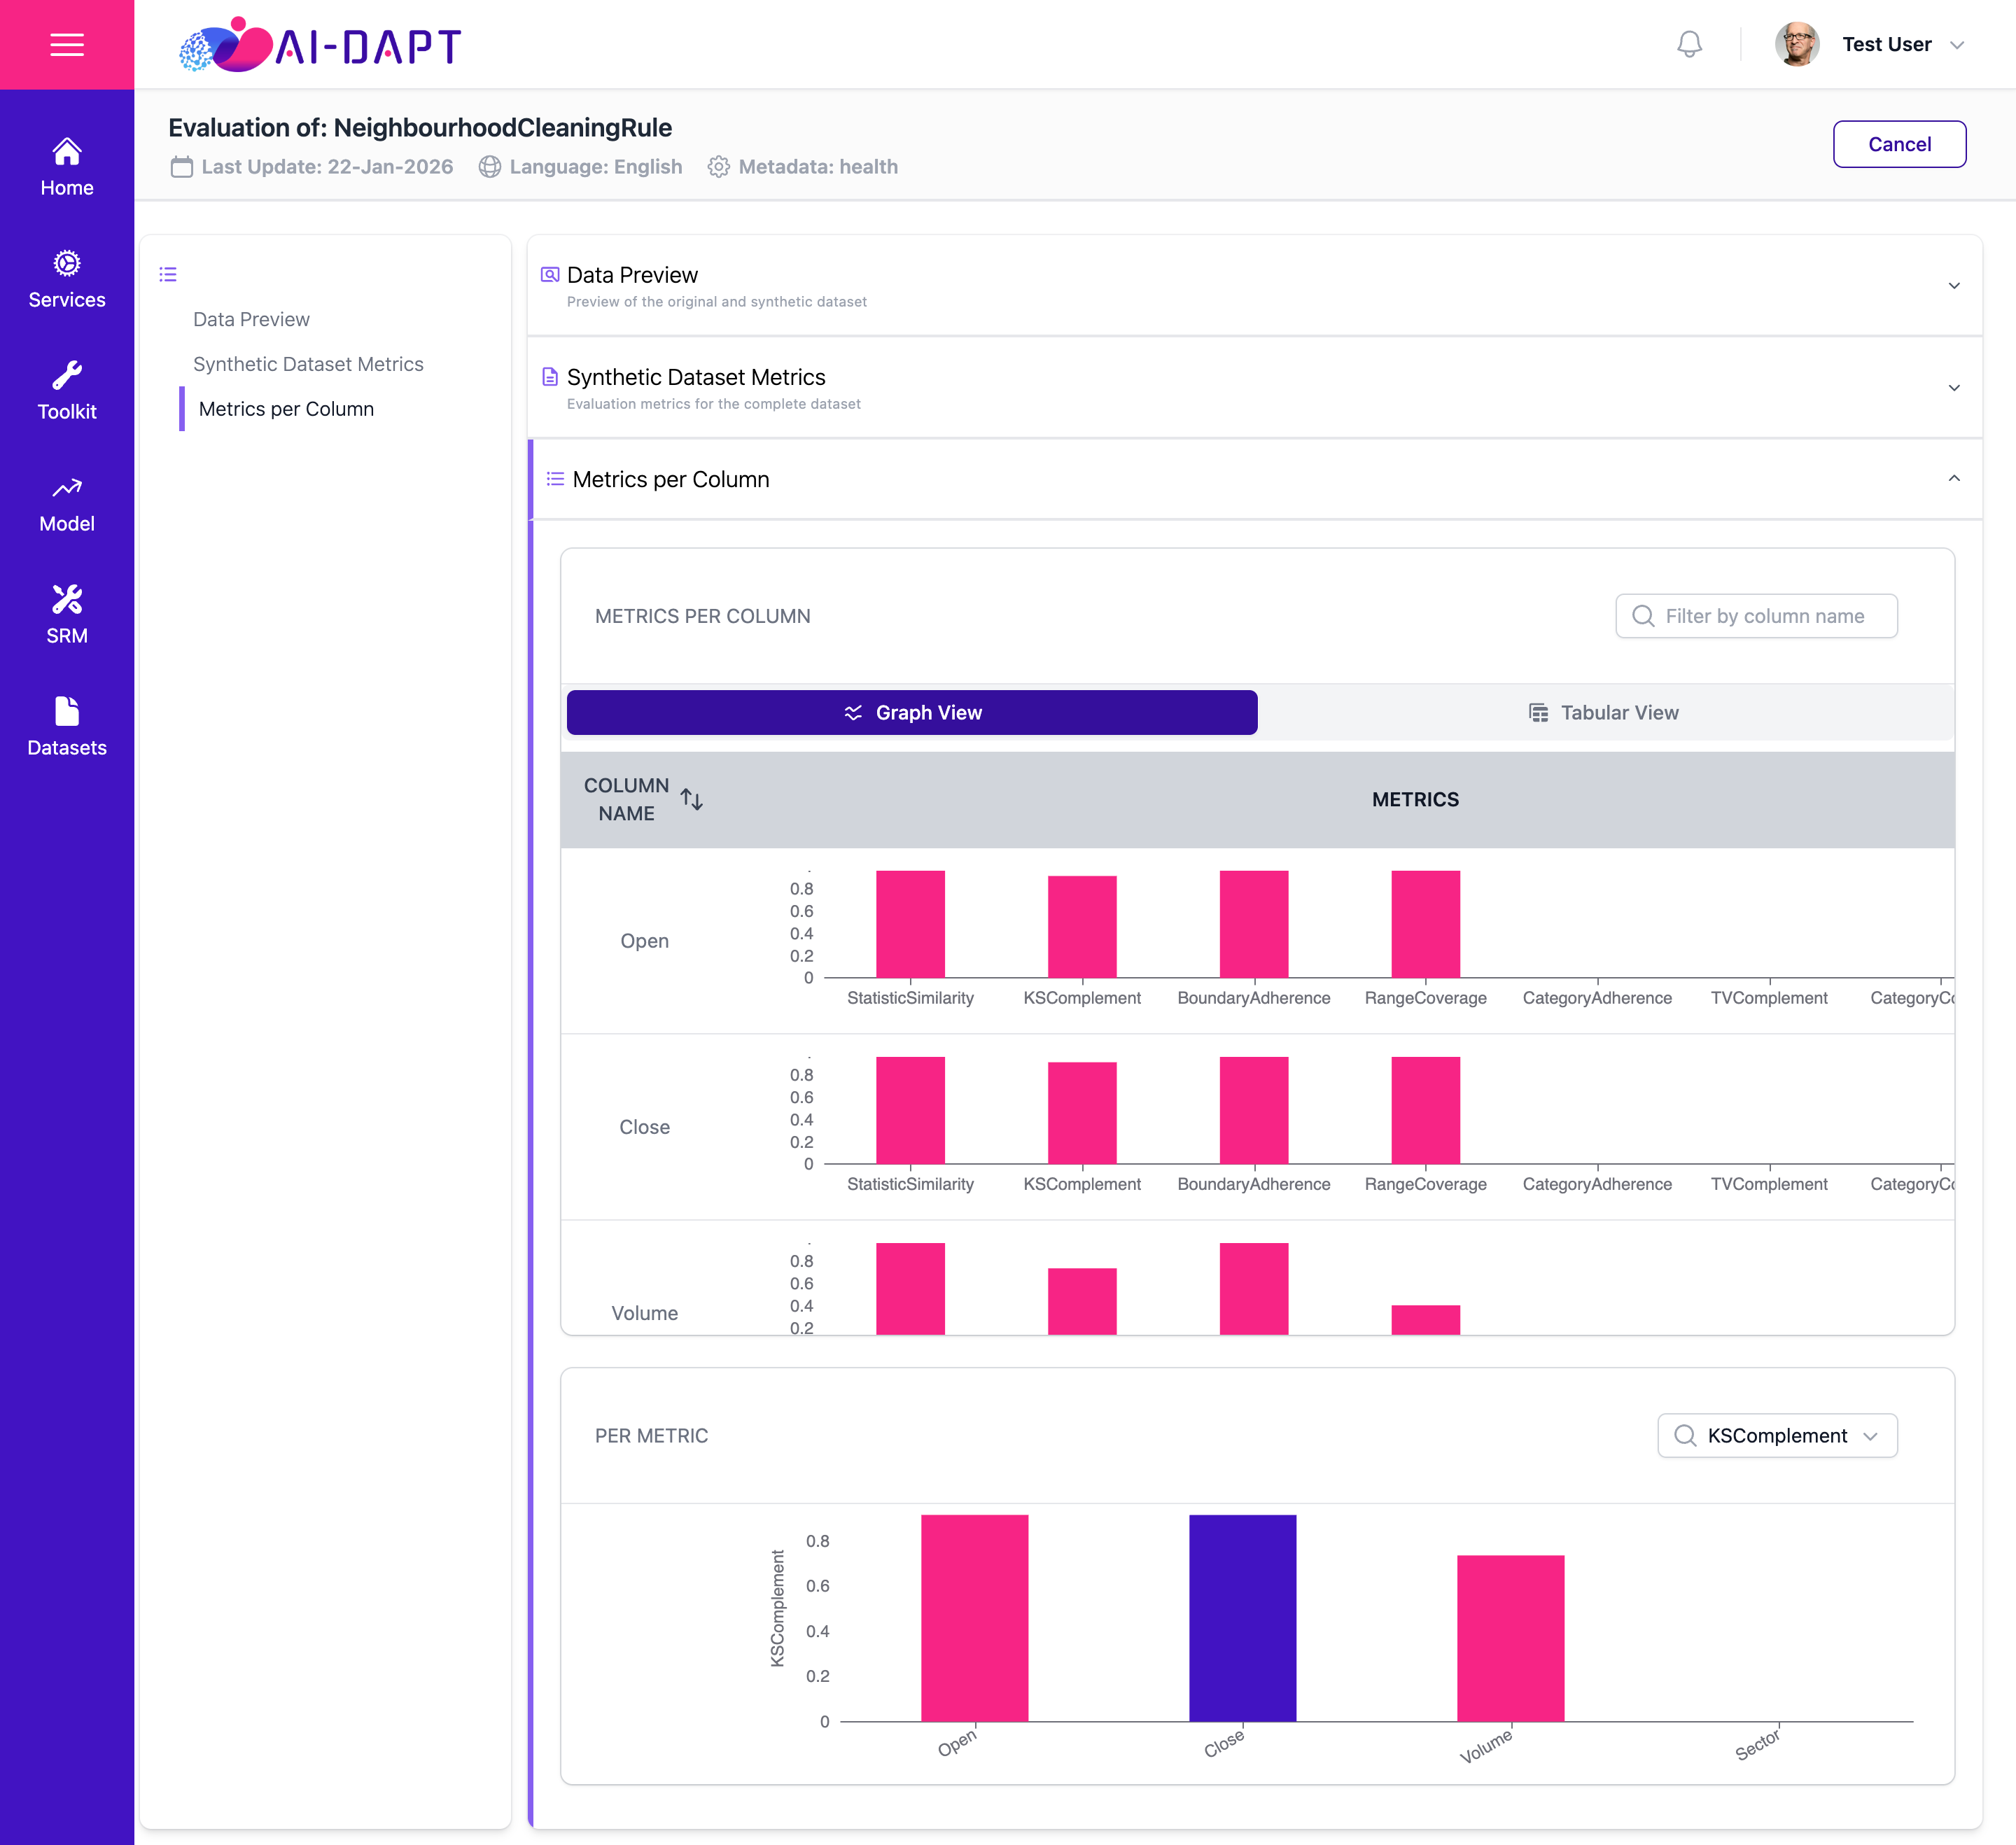
Metrics per Column
Offers a variety of metrics evaluating categorical and numerical columns specifically.
StatisticSimilarity: |
This metric measures the similarity between a real column and a synthetic column by comparing a summary statistic. (Metric used : mean). |
|---|---|
KSComplement: |
This metric computes the similarity of a real column vs. a synthetic column in terms of the column shapes — aka the marginal distribution. |
BoundaryAdherence: |
This metrics measures whether a synthetic column respects the minimum and maximum values of the real column. It returns the percentage of synthetic rows that adhere to the real boundaries. |
RangeCoverage: |
This metric measures whether a synthetic column covers the full range of values that are present in a real column. |
CategoryAdherence: |
This metric measures whether a synthetic column adheres to the same category values as the real data. |
TVComplement: |
This metric computes the similarity of a real column vs. a synthetic column in terms of the column shapes — aka the marginal distribution. |
CategoryCoverage: |
This metric measures whether a synthetic column covers all the possible categories that are present in a real column. |