Tutorial
Tutorial for the application.
Tutorial
This section provides a step-by-step demonstration of how the Interactive Experimentation Engine (IEE) component can be used and build to analyse a machine learning pipeline. Since integration with the Scalable Storage Services (SSS) has not yet been implemented, the example focuses on the local experimentation capabilities currently available in the component.
The main dashboard of the IEE component is organized into three key sections. The top section lists the available environments; each environment comes with pre-installed software packages tailored for specific tasks. For example, the Machine Learning environment includes packages like TensorFlow and PyTorch, making it suitable for deep learning workflows. The middle section displays the assets currently available within the environments, along with metadata such as names, creation dates, and modification timestamps. Finally, the bottom section is designed to show the assets available on the Scalable Storage Services; this area currently functions as a mockup.
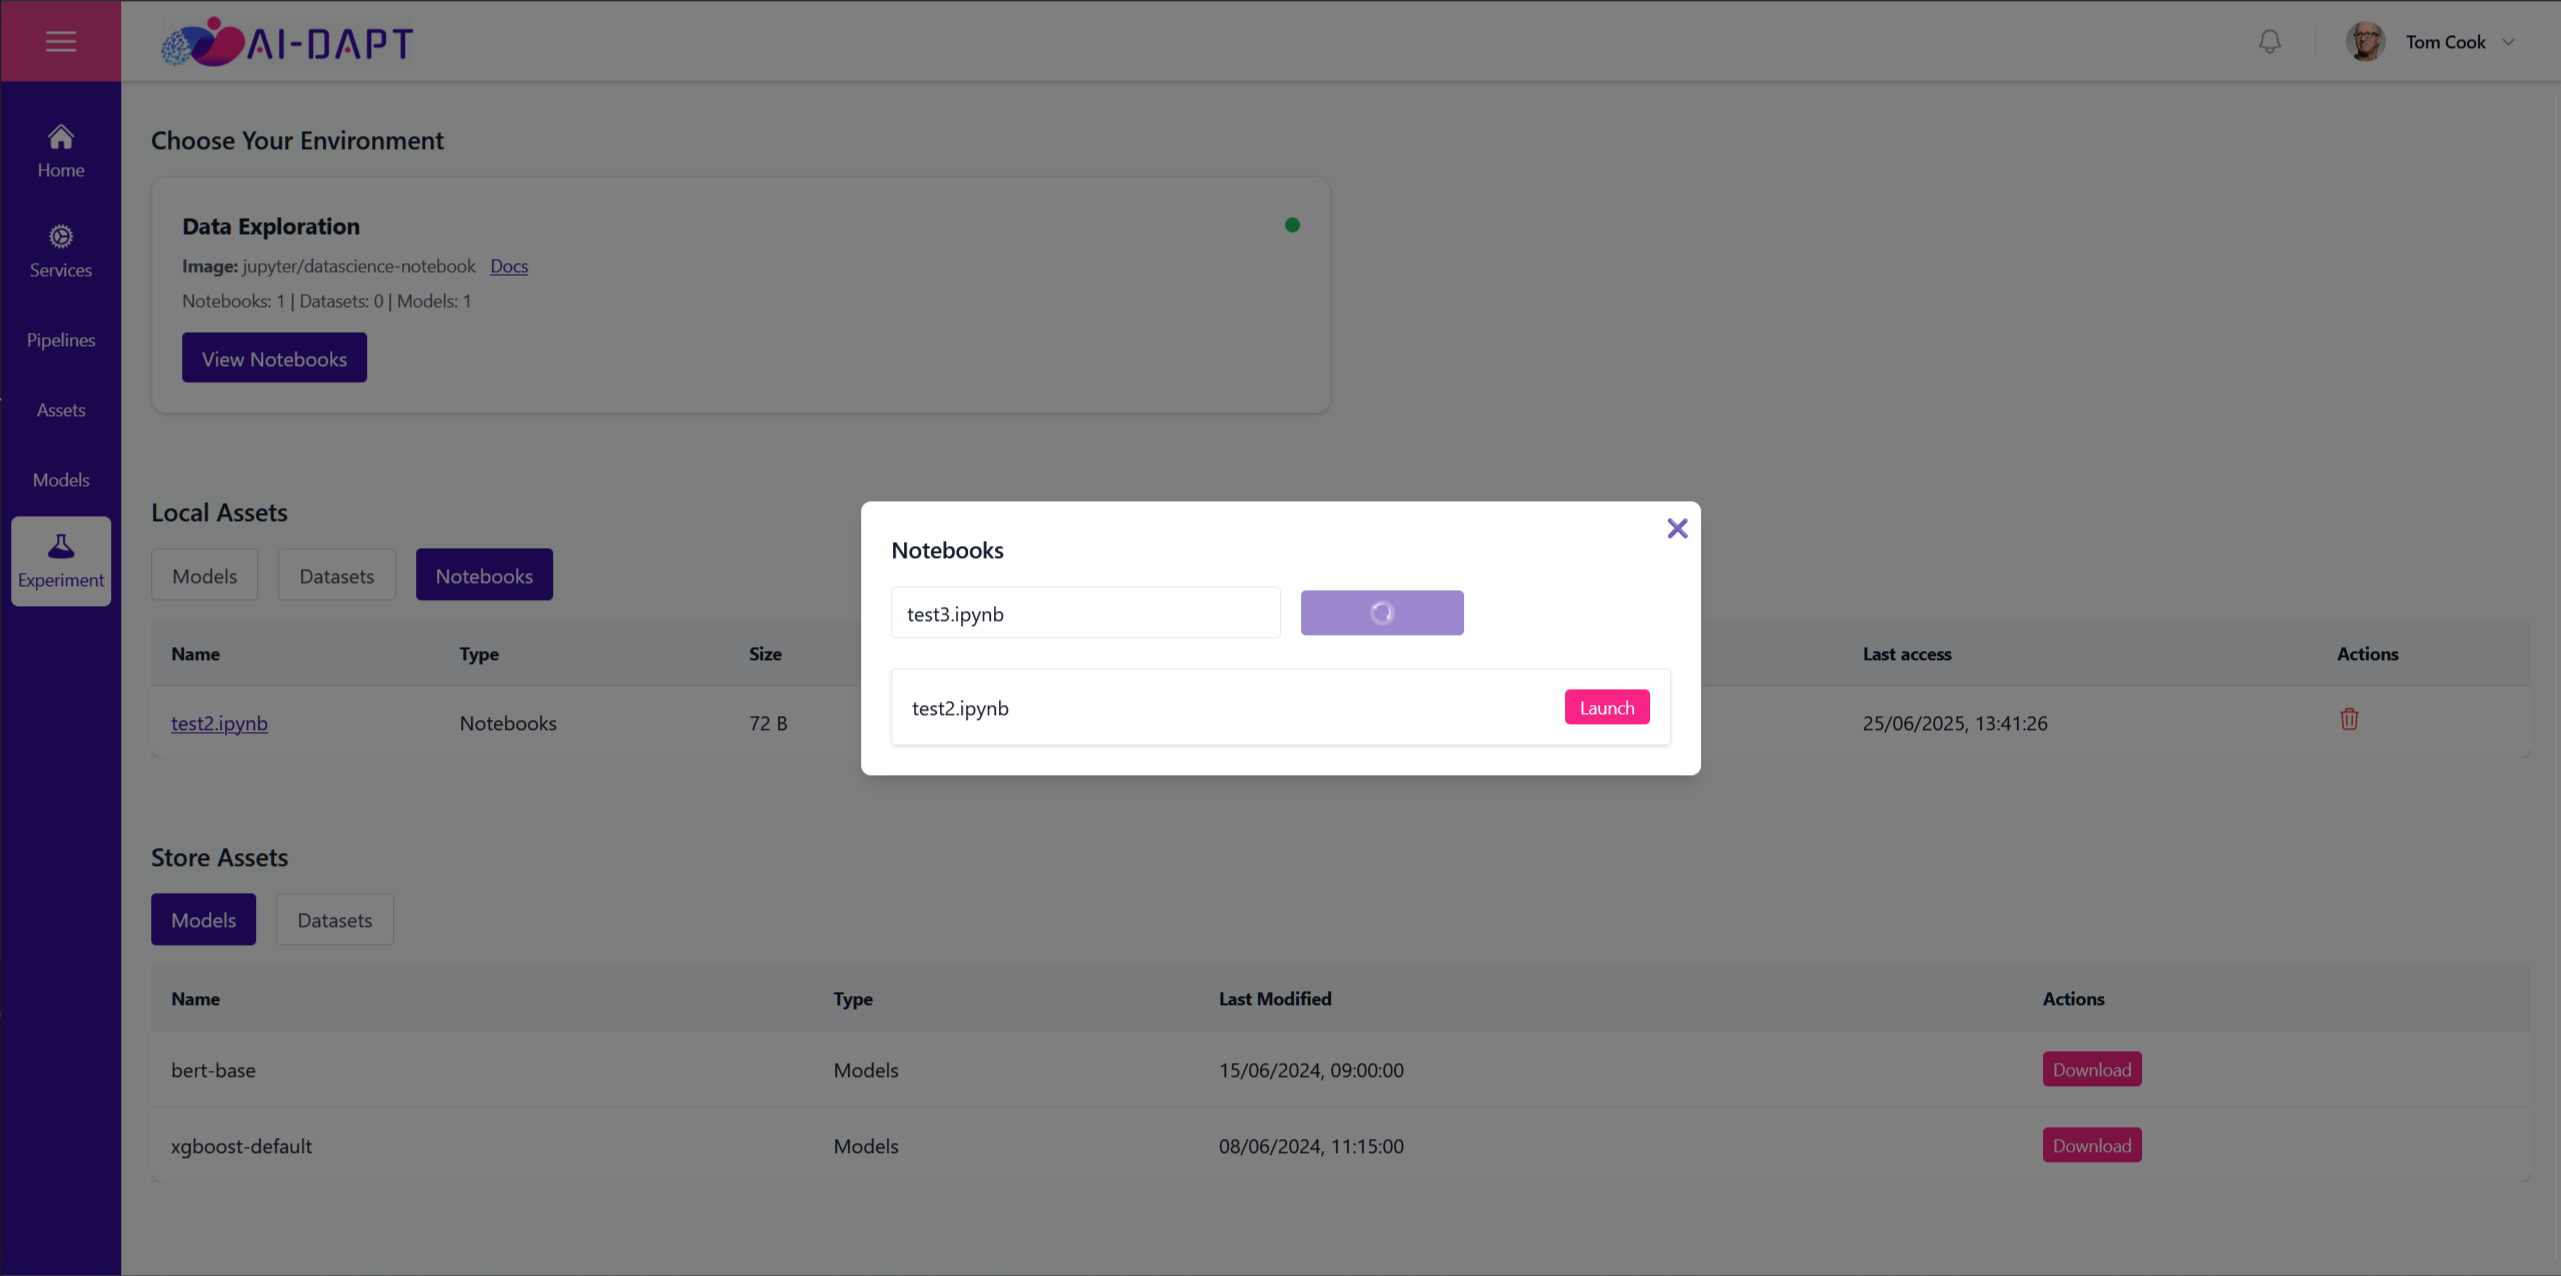 Figure 1:
Creating a Notebook in IEE component
Figure 1:
Creating a Notebook in IEE component
Once created, the notebook opens as an interactive workspace preloaded with the necessary Python libraries for data handling, model training, and explainability analysis. At this stage, the notebook is empty and ready for experimentation. Once created, the notebook opens as an interactive workspace preloaded with the necessary Python libraries for data handling, model training, and explainability analysis. At this stage, the notebook is empty and ready for experimentation.
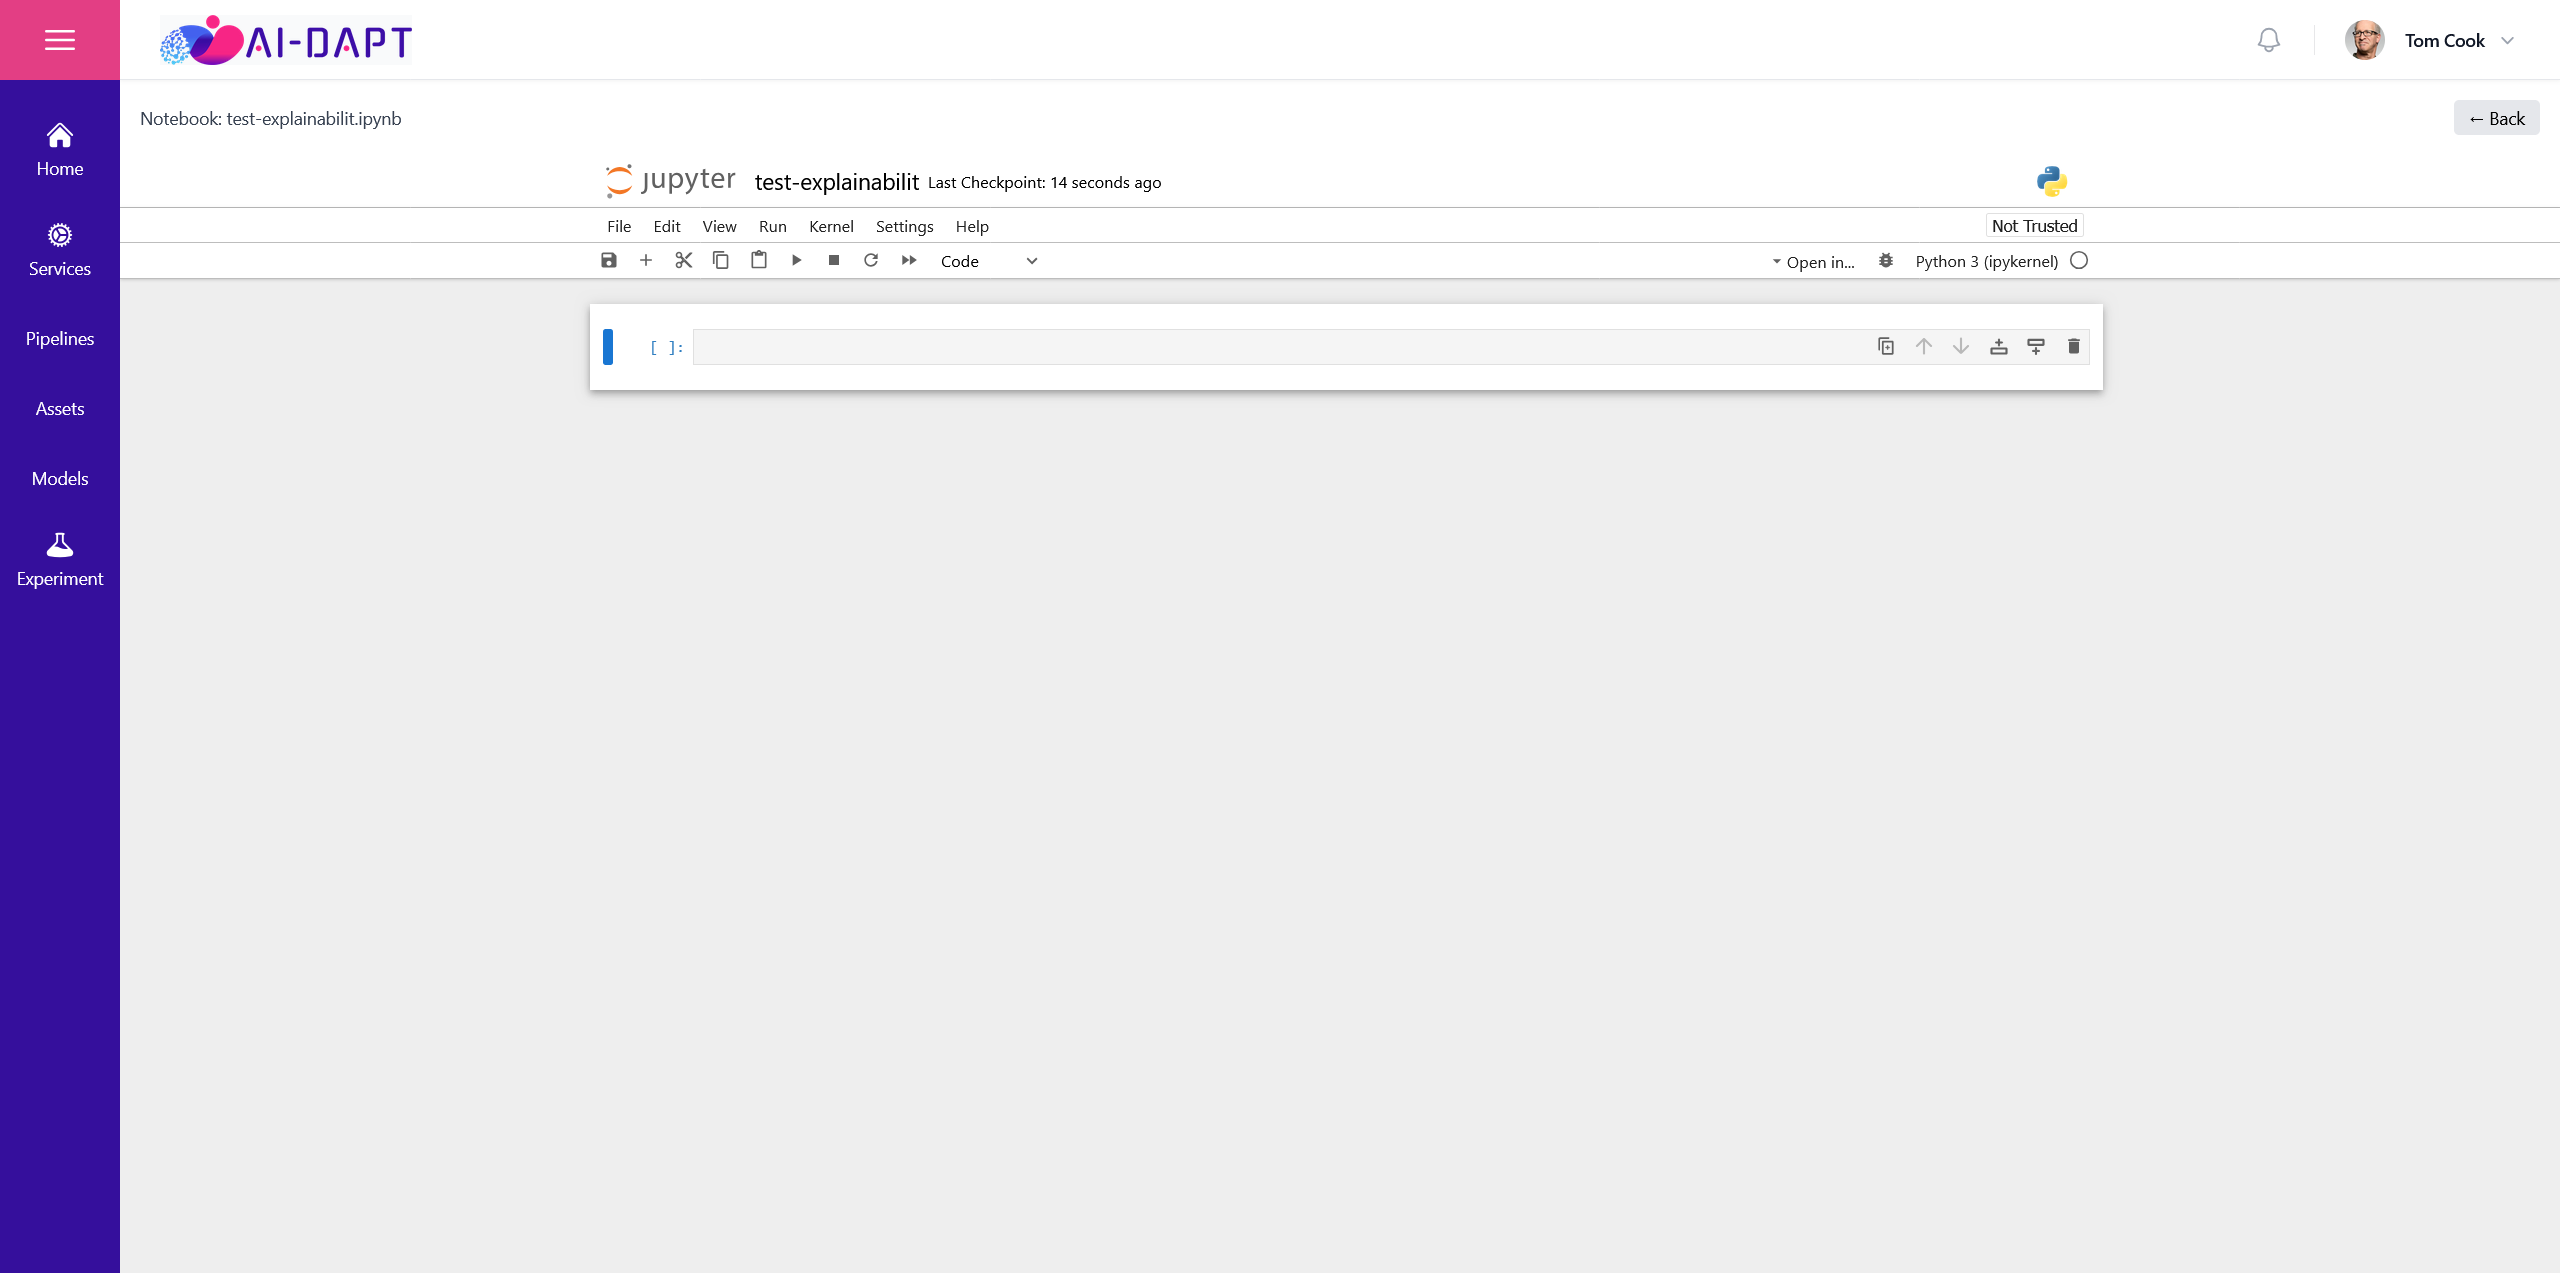 Figure 2:
Created Notebook in IEE component
Figure 2:
Created Notebook in IEE component
In this example, we use the notebook to train a linear regression model on a bike sharing dataset using standard Scikit-learn tools. The following code snippet demonstrates the end-to-end workflow: data loading, model training, evaluation, and prediction steps.
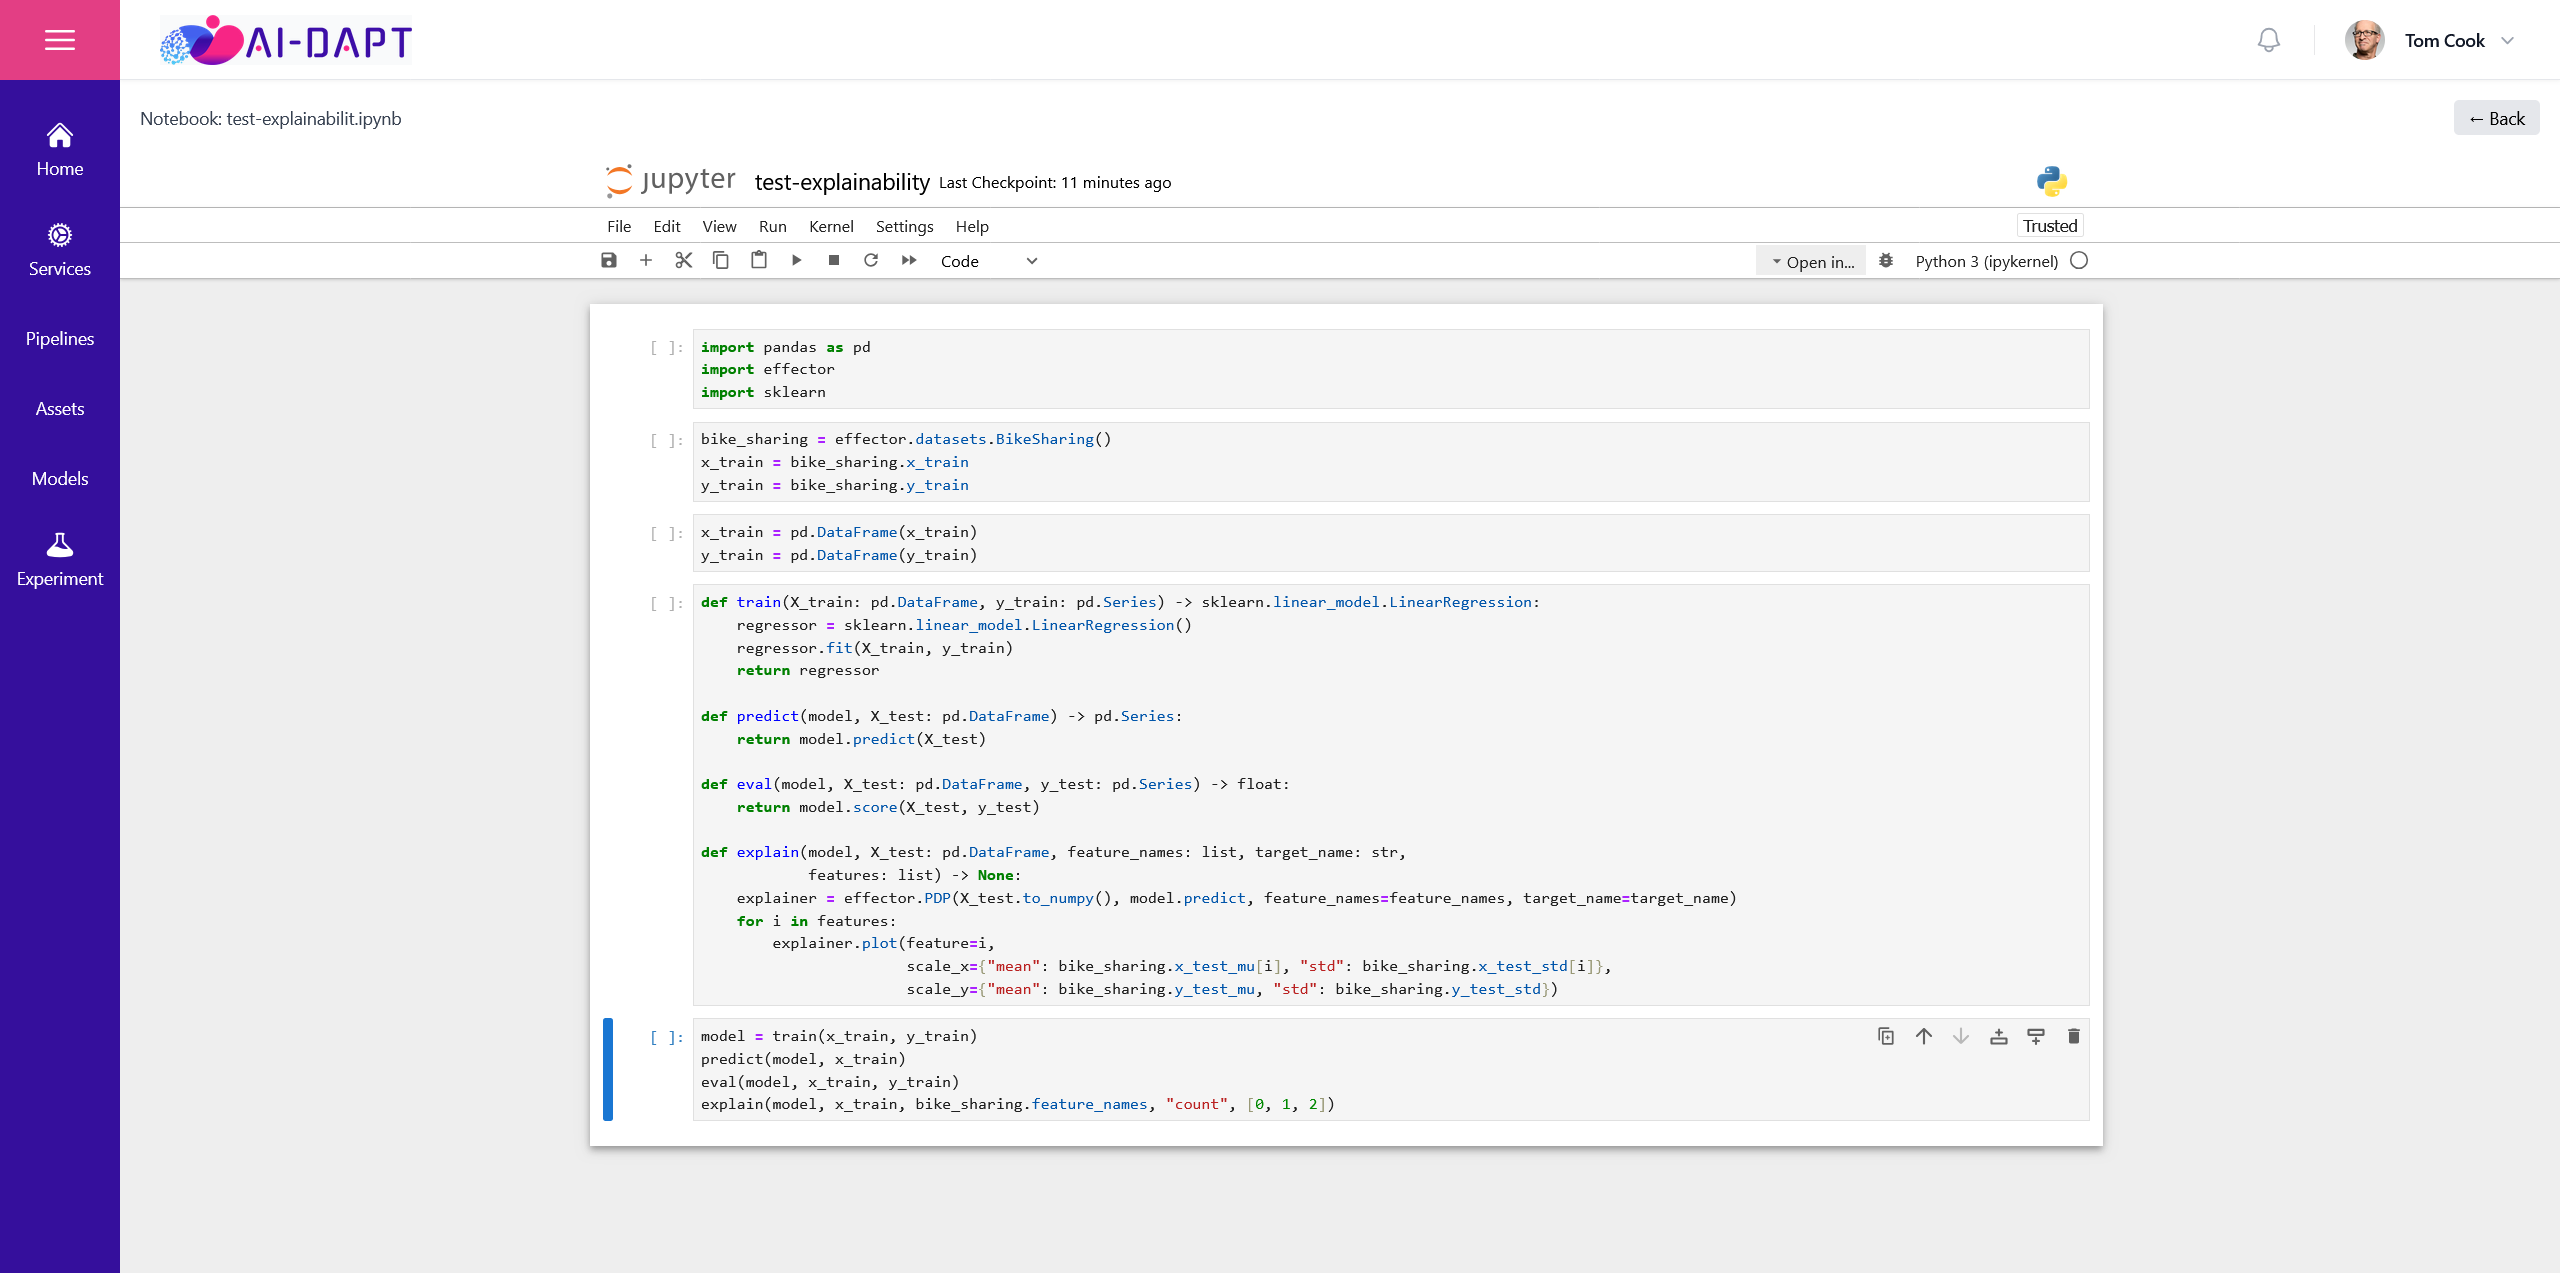 Figure 3:
Explainability Notebook in IEE component
Figure 3:
Explainability Notebook in IEE component
Finally, using the pre-installed Effector library, we generate partial dependence plots (PDPs) to evaluate model interpretability and visualize the effect of selected features on the model’s predictions. These explainability plots help users better understand model behaviour and feature contributions.
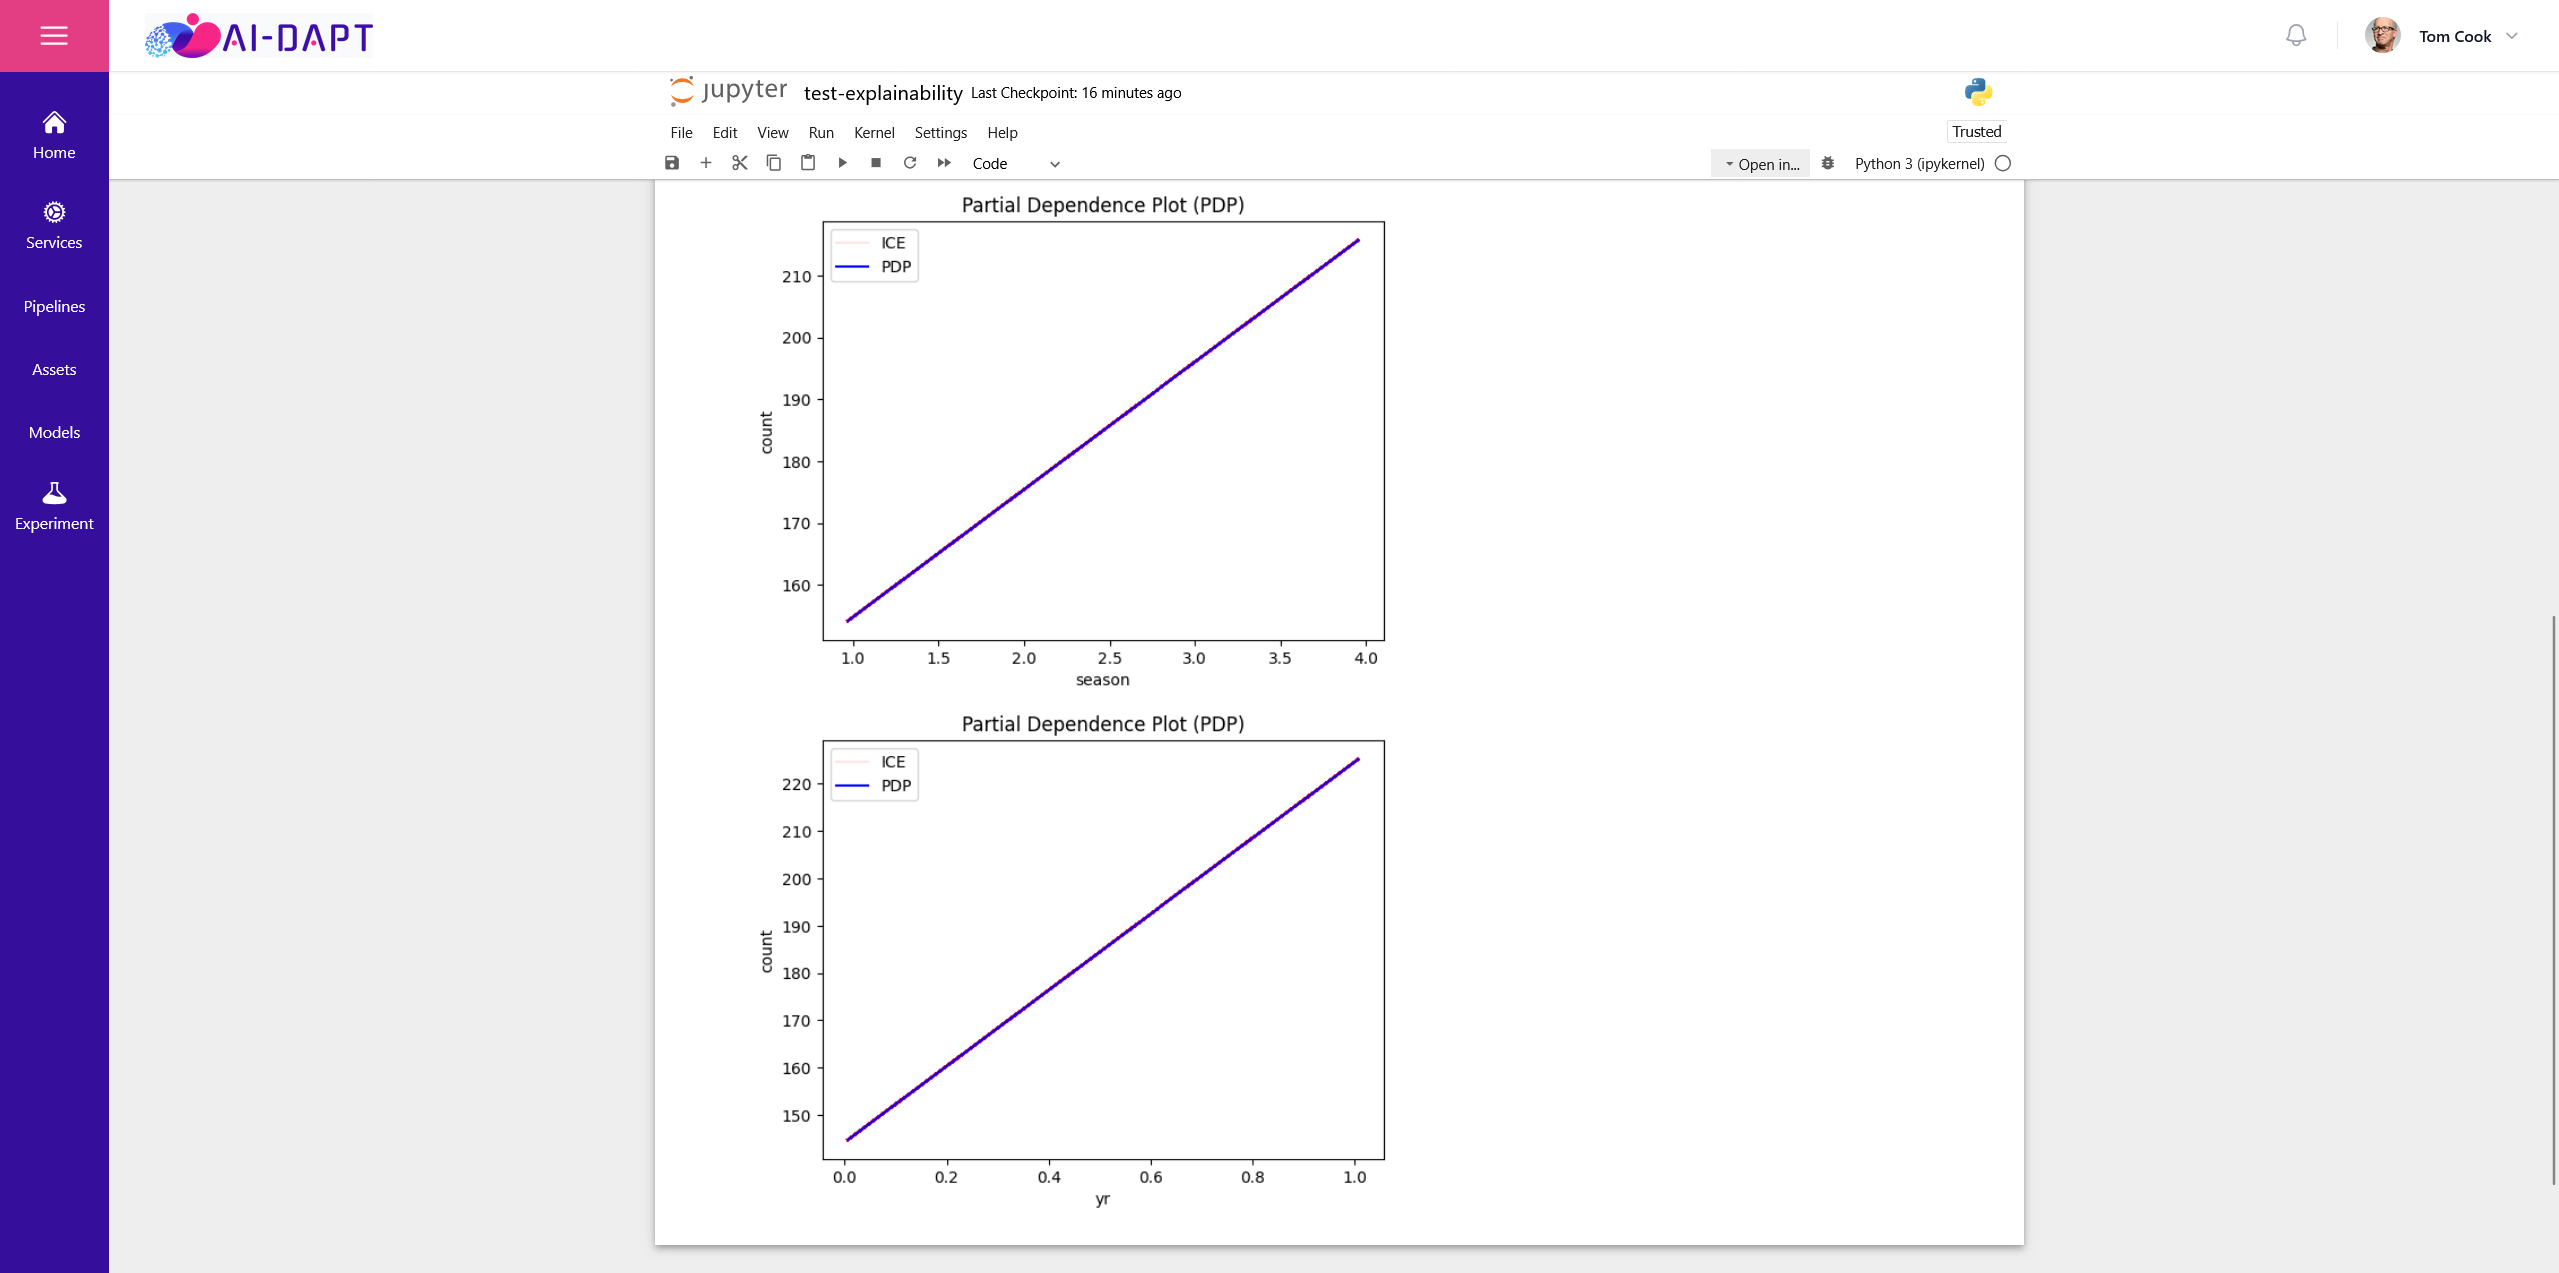 Figure 4: Partial
Dependence Plots in IEE component
Figure 4: Partial
Dependence Plots in IEE component